
On the Way to Elko
Eureka County, Nevada (2013)
Follow the ole Colonel on twitter @Eurekaminer
Next Week Target Gold Price: $1,590 per ounce, Target Silver Price: $17.95 per ounce.
My latest Kitco News commentary: Leading indicator for U.S./China trade - copper, gold & yuan (1/13/2020) [summary of recent commentaries given at the bottom of the blog]
An easy-to-understand overview on gold (32 slides, read explanation below each slide): History of gold and which countries have the most
Morning Miners!
Let's start with some good news. The Labor Department reported this morning that January added 225,000 new jobs versus an expectation of 160,000. Headline unemployment was little changed at 3.6%. The economy is clicking merrily along.
Stock markets also soared as interest rates rose in a relief rally this week that appeared less concerned about the Wuhan coronavirus and domestic politics. Comex April gold suffered some but caught a gear higher to $1,577.8 per ounce this morning, now trading at $1,576.9. Reversing its rally, Comex March copper retreated to $2.5495 per pound after running with stocks earlier this week.
What's going on?
I believe we haven't felt the full impact the virus will have on commodities. The World Health Organization reports 31,000 folks infected in China with 637 deaths - last Friday it was 10,000 cases and 200 deaths. About the only good statistic is the ratio of deaths to total cases. It has held fairly steady at 2% compared to 10% for the 2003 SARS outbreak - another variant of coronavirus.
Here's how I explained my concern to the Kitco News Weekly Gold Survey this morning:
Even with exuberant record-breaking stock markets this week and a stronger-than-expected jobs report this morning, I don't believe we have seen the worst from the coronavirus. Persistently negative correlations* of copper and oil with gold is a strong signal that the bottom is not yet in for copper, nor the highs for gold. For example, the gold-to-copper price ratio remains historically elevated at 619 pounds per ounce and above the August-September levels when the U.S./China trade anxiety peaked.** The broader Bloomberg commodity Index (BCOMTR:IND) is still below 160 this morning after enjoying pre-virus 170+ levels in mid-December [please see Summary Charts below].
Even with a relief rally this week, U.S 10-year Treasury yields have fallen in inverse relation to the gold-to-copper ratio rising. U.S. inflation expectations are also trending lower causing 10-year real rates to go marginally negative - a very bullish environment for a non-interest earning asset like gold
Lastly, gold which has struggled for weeks to regain value relative to record-breaking stock markets, is now on trend this morning relative to the benchmark S&P 500. This is a long-term trend of higher-lows established from October 2018 [Chart to Watch].
I believe it likely Comex gold will see $1,590 next week with its eyes on breaking the $1,600-level. Silver, which has lost some traction with its lustrous cousin, should follow higher to $17.95 per ounce.
* Correlations are persistent if the sign of short-term and longer-term correlations is the same - in this analysis, 1-month & 3-month correlations
** Gold-to-copper price ratio Sept. 3, 2020 = 616 pounds per ounce
*** 10-year U.S. real rate -0.06%; 10-year bonds: German Bund -0.39%, France -0.15% and Japan -0.05%.
This is what persistently negative correlations of copper and oil with gold look like:

Copper & Oil Correlations with Gold
Using the title to Clint Eastwood's most memorable spaghetti western, we have moved from "The Good" quadrant of positive persistence, transitioned to the "The Bad" quadrant of mixed correlations and now entered "The Ugly" quadrant of negative persistence - all in less than a month. Not a happy in commodity land. To learn more, checkout this Kitco column:

This is an excellent column on the next phase of the coronavirsus impact on commodities:
China Reneges on Commodity Deals, Worsens Global Trade Chaos (Stephen Stapczynski, Mark Burton and Jackie Davalos
Bloomberg, February 6, 2020)
I've been actively tweeting market news/events during the week so please follow me at @Eurekaminer. I usually tweet Sunday night on the Monday Shanghai Futures Exchange (SHFE) for a heads up on copper & gold prices in the Year of the Rat.
Weekly Summary
Here is a weekly summary chart of gold and my 16 favorite market variables. They are grouped in categories "Commodities", "Interest Rates", "Indexes" and "Currencies" of 4 variables each. Over time, each variable has played some part in the gold story. It is prudent to monitor all 16 to understand the key price drivers that are currently active for the yellow metal. Importantly, this is not a unique collection of variables but one that works well for the ole Colonel
Because The Eureka Miner is a morning report, Friday AM prices are compared with the closing prices of the previous week (click on charts for larger size):

This weekly chart of comparative value tracks the value of gold relative to key currencies, commodities and indexes :

Silver Watch
Comex silver slipped below $18 per ounce territory this week showing continued weakness relative to gold.
Please check this out if you get the silver bug:
How to Invest in Silver (Debbie Carlson, U.S. News & World Report, August 1, 2019)
How to smartly buy gold and silver:
How to Mine Physical Precious Metals for an IRA (Debbie Carlson, Barrons, Sept. 8, 2019)
The gold-to-silver ratio (GSR) set a new high July 11 at 91.3 ounce per ounce - a trend down from this top is bullish for silver if the Lustrous One rallies.
At 88.59, silver is historically very cheap relative to gold!
The 10-year average GSR is much lower at 67.7 ounce per ounce.
The 3-month beta with gold fell again this week, currently an unattractive 0.83 (i.e. on average the daily % rise or fall of silver price is beta times the % change in gold price).
(click on image for larger size)
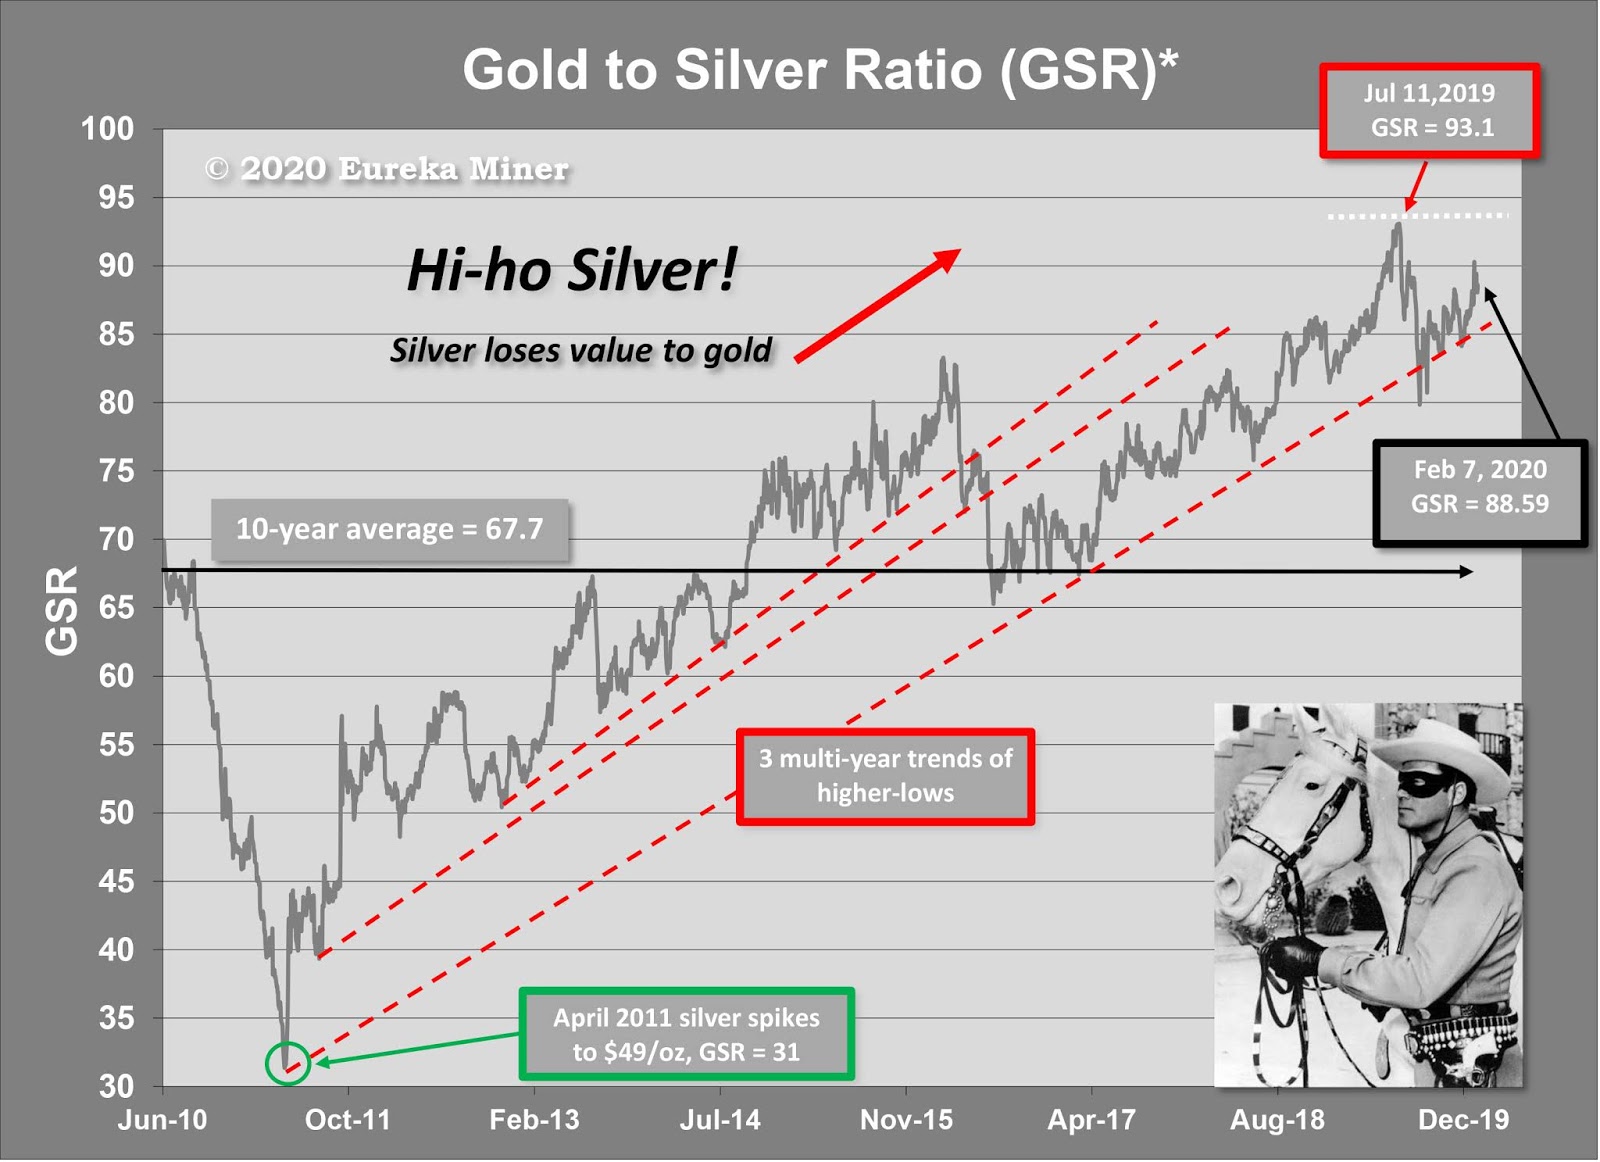
Gold-to-Silver Ratio
Note that this week, the GSR is near long-term trend line of higher-lows established in April 2011 when silver flirted with $50 per ounce. A GSR falling below this trend is bullish silver.
Historical note:
In the past, when gold and silver were legal tender (see gold overview link below headline photo), it was important to set a value relationship between them. In 1792, the U.S. fixed its price at 15:1. This means that 1 troy ounce of gold was worth 15 troy ounces of silver. Over the years, as this ratio has changed, precious metal investors have used it as a signal of when to buy.
Stay tuned.
Inflation Watch
Inflation expectations made a high April 23, 2018 above trend lines of higher lows (dotted lines, click on chart for larger size). Those trend lines were broken dramatically to the downside. Expectations are retreating but still above the October, 2019 low.

10-year Inflation Expectations
Note: In the above chart inflation expectations peaked April 23, 2018 at 2.18%. May 29 broke a trend line of higher-lows. This week, expectations are 1.67% as of Thursday up from the October 3 low of 1.48%.
Many believe, including the ole Colonel, that gold price is more sensitive to inflation expectations than other measure of inflation. My January Kitco News commentary explains the importance of tracking "real rates" which are a function of inflation expectations:
Gold Versus Real Rates: $1,380+ by May Day 2019 (Kitco News, 1/2/2019)

Old Glory
Eureka, Nevada
Chart to Monitor
Here's a chart to monitor for 2020 (Click on the image for a larger size):

An important gold ratio is gold-to-S&P500 or AUSP. The ratio bottomed in early-December of 2015 and reversed to a bullish trend, peaking February 11, 2016 (0.6849). It bottomed December 20, 2016 (0.4973) trended higher but then bearishly reversed into a downward channel bottoming again October 1, 2017 (0.4063). Currently this AM the AUSP is at 0.4744 and below the high of 0.5409 set at the close December 21, 2018. Importantly, the ratio has left the downward trending channel with a new trend of higher-lows starting with the October 2018 low. That trend was challenged but now appears intact (red arrow & circle).
Six Things to Watch in 2020
The ole Colonel's beer bet (won on an intraday basis Tuesday, January 7th!):
Gold will break [on a closing basis] $1,600 on per ounce before the 4th of July 2020
Let's keep the bet alive by looking at closing instead of intraday prices - what a sport!
My top six things to watch for 2020:
- Copper prices - I'd like to see copper prices push us above $6,500 per tonne ($2.95 per pound). A fall below the $6,000-level ($2.72) would be a bad sign - for example, U.S./China trade Phase I in trouble or escalating geo-political unrest. [Update: Wuhan Coronavirus has pushed copper below $6,000 per tonne].
- Chinese yuan - strengthening below 7 USDCNY is a good sign that their economy and trade are on an improving track (Weekly Summary). Sustained weakening above the 7-level is a red flag.
- U.S. dollar - will it remain strong or begin a period of decline? Foreign demand for Treasury debt has kept the dollar strong but rising U.S. deficits and countries trying to move away from dollar dependence (e.g., China, Russia) are countervailing forces not to be ignored. The U.S. Dollar Index (DXY) made its high September 30 this year and has been in a downtrend of lower-lows since (99.38 September high). This reports tracks the Invesco DB US Dollar Index Bullish Fund (UUP) (27.01 September high, see Weekly Summary below for latest price). Finally, overseas interest in Treasurys has been fueled by negative interest rates abroad. This report monitors the German 10-year bund (Weekly Summary) as a benchmark for foreign Treasury demand.
- Interest Rates - there is an almost uncanny relationship between the yield on the benchmark U.S. 10-year Treasury and the copper-to-gold ratio (CGR, Weekly Summary). I've written about this extensively since 2017 ( see The Colonel's Latest Kitco News Commentaries below). Bottom line, a rising CGR signals higher interest rates for 2020. [Update: Wuhan Coronavirus appears to have reversed the trend higher].
- Real rates - The 10-year inflation adjusted Treasury yield, or real rate, is the difference between the nominal yield and inflation expectations (aka 10-year "break-even" rate). Since gold is a non-interest bearing assets it performs best when real rates are near zero or negative. This report tracks real rates (Weekly Summary) and inflation expectations (Inflation Watch). Since gold is often considered an inflation hedge it is prudent to track both. In 2020, inflation may pick up (gold bullish) but if interest rates rise faster, an increasing real rate dampens interest in in the yellow metal (gold bearish).
- Gold-to-S&P 500 ratio (AUSP) - Gold's relationship with equities is key to monitor. Gold lost value to the S&P 500 from Donald Trump's election until October of 2018. Since then it has regained value in a trend of higher-lows (see Chart to Watch below). We entered 2020 with that trend higher challenged. Falling below trend would be a very bearish sign for gold. [Update: Wuhan Coronavirus has put the AUSP above trend, a bullish sign for gold].
Predictions aside, 2020 will no doubt be an exciting year in the markets. Get ready for a roller-coaster ride, pardner. I remain bullish gold!
The Colonel's Latest Kitco News Commentaries
Please checkout my latest Kitco News columns on the stunning relationship of copper and gold prices with interest rates:
Leading indicator for U.S./China trade - copper, gold & yuan (1/13/2020, Kitco News)
Is Jeffrey Gundlach right about copper, gold & interest rates? (12/23/2020, Kitco News)
Gundlach indicator: stable copper-gold means low yield volatility (11/11/2019, Kitco News)
Gundlach Indicator: treasury yield and copper-gold ratio plummet (9/03/2019, Kitco News)
Robust Revival of Gundlach's 10-yr Treasury Relation with the Copper-Gold Ratio (6/17/2019, Kitco News)
Here is my China Indicator updated through this morning (see above 1/13/2020 Kitco column). A low number is good. A bottom occurred after the signing of the Phase I deal of 0.3011. This AM the indicator sits at 1.8337 propelled higher by the Wuhan Coronavirus (click on chart for larger size).

China 2-rho Divergence Indicator
Cheers,
Colonel Possum & Mariana


.png)


.jpg)


.jpg)
No comments:
Post a Comment