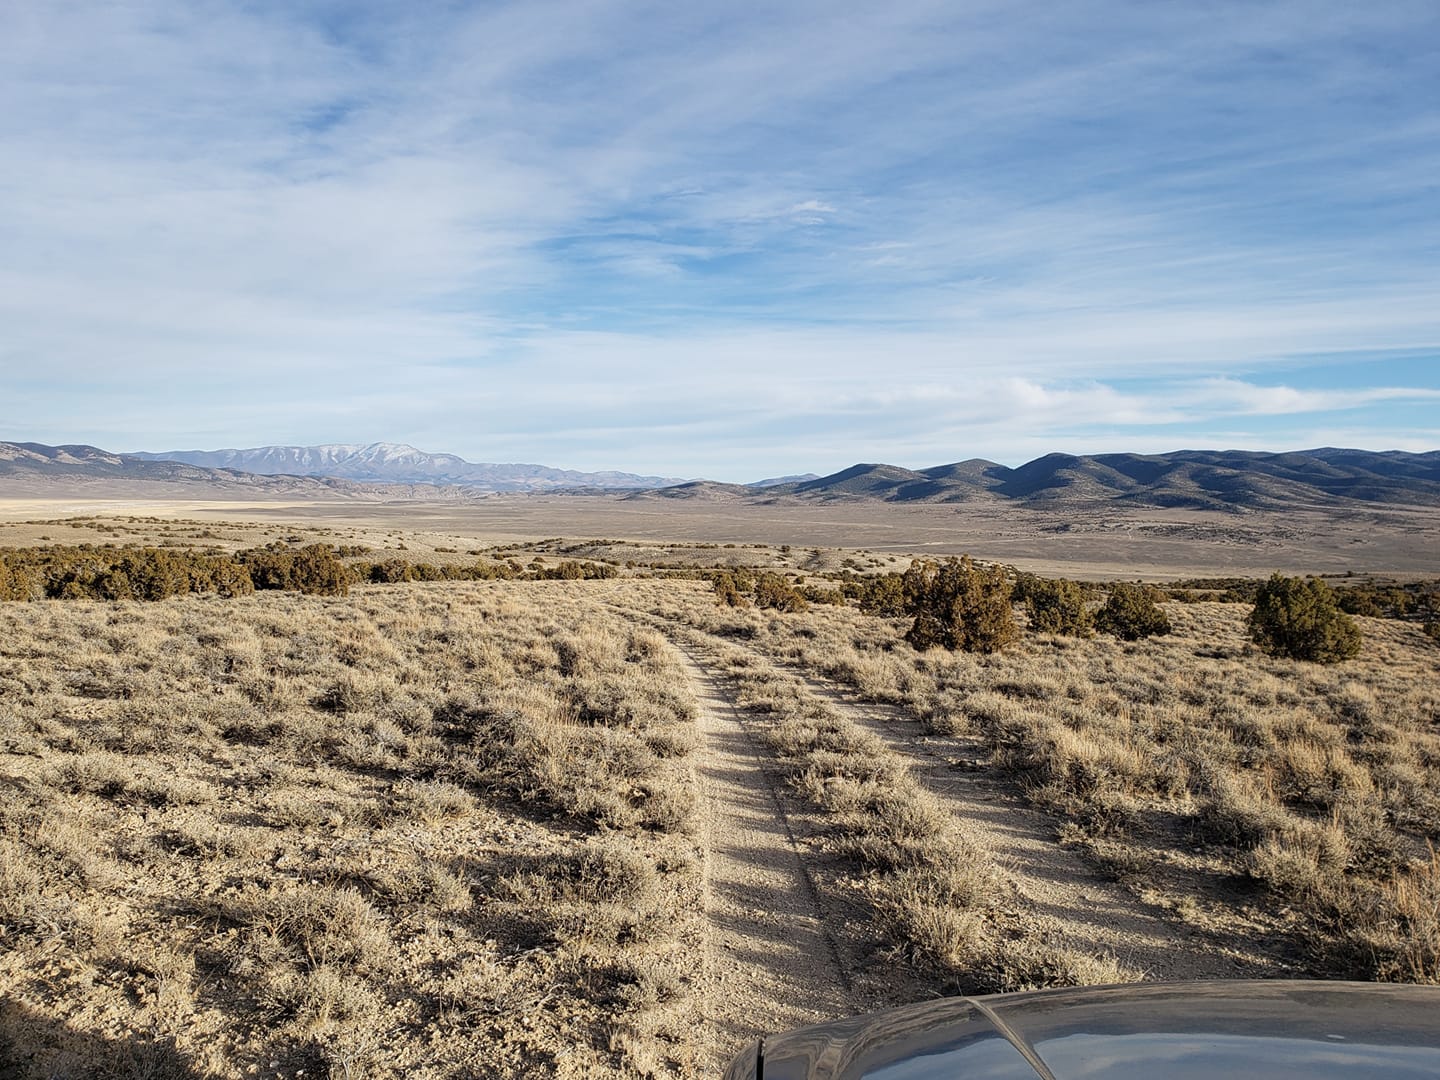
"The history of Eureka lies in its future." - Lambert Molinelli, 1878

DISCLOSURE

The author/editor of the Eureka Miner owns common shares of local mining stocks, McEwen Mining (MUX) and General Moly (GMO). Please do your own research, markets can turn on you faster than a feral cat.

Thursday, March 31, 2011

Buffet, POSCO (PKX) and Molybdenum


Þūnresdæg
Morning Miners!

It is 5:44 AM. Have a cup of Viking Vengeance, our favorite Norseman just heated up the pot with his number 3 thunderbolt. We'll need another talk, the ole Colonel doesn't like anything stronger than number 2s going off in the shop. I've got to think of the neighbors!

Warren Buffet Bullish on South Korea

This week's news on billionaire investor Warren Buffet has not been good. His number one guy David Sokol resigned amid controversial revelations about his personal stock trading. Mr. Sokol was seen by many to be grandpa's successor and now Berkshire Hathaway will no doubt be in a spin to find a new contender.

This is all great headline fodder but I found Buffet's recent trip to South Korea to be a lot more interesting, at least in how it may affect the fortunes of Eureka County someday. Here's an article about Mr. Buffet's trip in the Wall Street Journal posted before the Sokol dust up:

Warren Buffett in South Korea: We’re Hunting For Deals! (Dave Kansas, WSJ, 3/21/2011)

The article reminds us that besides seeking new opportunities, Warren Buffet is still keen on South Korean steelmaker POSCO owning about 4% of the company. POSCO owns 20% of General Moly's Mt. Hope molybdenum project, so by my way of thinking the Sage of Omaha owns about 1% of that lonely mountain top some 21 miles north of Raine's Market.

"[Warren Buffet] also had soothing things to say about Japan, arguing that the earthquake/tsunami disaster will not shake Japan’s overall economic direction," the article goes on to say. He and other savvy investors no doubt see steel demand rising in that part of the world as Japan begins to pick up the pieces and rebuilds. Molybdenum is a key alloy in making high grade steels, so what's good for steel is good for moly miners.

POSCO (PKX) on the rise

So how is POSCO doing? Pretty durn good, pardner. Amidst all the recent global turmoil, POSCO has been on a tear. Compared to steel giant ArcelorMittal (MT), POSCO is up 9% for the year while MT is down 4%. Here's a comparative 3-month chart (PKX blue, MT green):


POSCO stock price is nicely above its 200-day average heading for $120 territory. POSCO closed yesterday at $117.57, the 52-week high is $125.97. Here is a 1-year chart of stock price (blue) plotted versus the 200-day moving average (green):


Last December, I mentioned that POSCO may be a good stock to look at for 2011 (Buy POSCO?) when it was trading at $102.98. Now, don't you wish you'd listened to your ole Colonel? Please do your own checking on steel producers before you jump into the melting pot.

What happened to $20/lb Molybdenum?

OK, I did expect molybdenum prices to be higher than they are right now - that was before Chinese monetary tightening, tsunamis, nuclear melt-downs and revolts in the Arab world. Now global growth is in question again and all the metals are experiencing a wait-and-see. The Colonel has a bet that Western moly oxide will break $20 before the Fourth of July and I'll admit that sounds a little scary now. European moly oxide has been heading in the opposite direction recently breaking its lower trend line to sit at $16.72/lb. Western moly oxide has been hanging tough at $17.00/lb but neither Western or European has shown any inclinations to head higher.

The LME futures contracts may be telling us a different story as they move back toward $18/lb pasture. Here's the line up:

LME cash seller: $38,050/tonne ($17.26/lb)
LME 3-month contract: $38,500/tonne ($17.46/lb)
LME 15-month contract: $39,150/lb ($17.76/lb)

Let's put the futures to a test. I'll bet a beer that European moly oxide spot prices will reverse and break $17.20/lb before May Day (you can checkout the Colonel's other beer bets for 2011 in the right column near the end of the blog page). How's that for a positive outlook? Go Buffet, go POSCO, go Miss Moly!


Daily Market Roundup

Enough talk, let's walk the walk:

Eureka Miner's Index(EMI)

This morning the Eureka Miner's Index(EMI) is above-par at 457.04, up from yesterday's 451.92 and above the 1-month moving average of 376.08. The EMI continues to be down from the high set on January 4th and up from the March 15th low of 262.02 - a trend reversal may again be in the works.

The EMI gives us the market temperature for the factors that have the greatest impact on mining in Eureka County. The record high for the EMI is 816.78 set 01/04/2011; the low was set 6/7/2010 at 50.7. An EMI of 100 is the boundary between good lands and bad lands for the metals & miners.

200-day averages are used in the EMI to normalize current mining company share price and are updated monthly. Upper and lower trend lines are updated weekly.

Gold Value Index (GVI)

Our newly minted Gold Value Index (GVI) is below-par at 70.12, down from yesterday's 70.15. The 1-month moving average is 71.05. Today's Value Adjusted Gold Price (VAGP) is $1,712.8/oz.

The GVI gauges the value of gold in relation to oil, copper and silver independent of currency. Although gold prices have been on the rise, the GVI has been trending down since 6/7/2010 when it had a value of 100. These three commodities were chosen for relative value comparison because 1) oil is a common cost element for all miners, 2) copper has been a reliable proxy for global growth and 3) silver is a precious metal that now competes with gold for investment and as a hedge against fiat currencies.

The Value Adjusted Gold Price (VAGP) is a level that supports current oil, copper & oil prices based on historical commodity norms. If the daily COMEX gold price is below the VAGP, then gold is undervalued; if above, overvalued.

Daily Oil Watch

On February 1st we identified North Sea Brent crude oil as a good barometer for the developing crisis in the Middle East and North Africa. It is still above $100/bbl with a large but narrowing spread from the North American benchmark, Western Texas Intermediate or "Texas light sweet crude", traded on the NYMEX (see note 1). The Report normally follows the latter but will track both until things settle out in the region.

Here are the key front-month contracts as of this morning:

NYMEX light sweet crude $106.47
ICE North Sea Brent crude $117.28
Spread (ICE- NYMEX) = $10.81 (Yesterday $10.70)

Here are the July contracts* with a narrower spread:

NYMEX light sweet crude $107.44
ICE North Sea Brent crude $116.93
Spread (ICE- NYMEX) = $9.49 (Yesterday $9.45)

*(the most active front-month contracts are now May so we moved from June to July contracts for a 2-month look-ahead).

Although prices are off their crisis highs, we have $100+ Brent and NYMEX in July favoring higher oil prices through the summer. My December prediction that we would see NYMEX $100/bbl oil before the Fourth of July came true on February 23rd.

Eureka Outlook Dashboard

4-WD is ON - The miners are still in a real rough patch but Freeport may pull us out of the mud hole yet; The VIX or "fear index" is below 25; bellwether Freeport-McMoRan (FCX) is above its 50-day and 100-day moving average today and is comfortably above its 200-day average of $44.85 (our new warning level, 03/04 update); 10-year Treasurys are safely below 4% preserving a low-interest rate environment.

The GREEN light is turned back on for Commodity Reflation with copper trading comfortably above $3.50/lb

The GREEN light is turned on for Stable Markets with the VIX below the 30 level (what's this?)

The YELLOW light is turned on for Inflation Watch as the Federal Reserve resumes buying Treasurys (aka QE2)

The GREEN light is turned back on for Investor Confidence as investment returns to the equity markets

The RED light is turned on our Fuel Gauge with oil above $100

A ORANGE light is ON for possible adverse regulation/legislation: Mine Safety Violations, Miner's claim fee, Miner taxation, Cortez Hills, mercury emissions , General Moly Mt. Hope Water Rights, U.S. House committee debates miner workplace safety bill, R&R Partners parts ways with Nevada Mining Association, Obama budget includes mining royalty , Mineral commission fights consolidation, Democrats seek to repeal mining tax from the constitution, Rhoads, Ellison oppose repeal of net proceeds tax

Otherwise, all lights are green on the Eureka Outlook Dashboard (upper right, what's this?)

Commodity Market Morning Update

NYMEX/COMEX: Oil is up $2.20 in early trading at $106.47 (May contract, most active); Gold is up $12.4 to $1437.3 (June contract, most active); Silver is up $0.274 to $37.785 (May contract, most active); Copper is up $0.0155 to $4.2895 (May contract, most active)

Western Molybdenum Oxide is $17.00; European Molybdenum Oxide is $16.72; LME cash seller is $17.26, LME moly 3-month seller's contract is $17.46

Stock Market Morning Update

The DOW is up 3.30 points to 12,354.55; the S&P 500 is down 1.34 at 1326.92

Miners are up:

Barrick (ABX) $52.03 up 0.93%
Newmont (NEM) $54.62 up 0.92%
US Gold (UXG) $8.84 up 1.38%
General Moly (Eureka Moly, LLC) (GMO) $5.32 up 0.76%
Thompson Creek (TC) $12.43 up 0.32%
Freeport-McMoRan (FCX) $55.75 up 0.92% (a bellwether mining stock spanning copper, gold & molybdenum)

The Steels are up (a "tell" for General Moly & Thompson Creek):

ArcelorMittal (MT) $36.53 down 0.57% - global steel producer
POSCO (PKX) $115.9 down 1.85% - South Korean integrated steel producer

The Eureka Miner's Grubstake Portfolio is is up 0.54% at $1,910,290.90 (what's this?).

Cheers,

Colonel Possum

Note 1 - West Texas intermediate (WTI), also known as Texas light sweet, is a type of crude oil used as a benchmark in oil pricing and is the underlying commodity of New York Mercantile Exchange's (NYMEX) oil futures contracts. The price of WTI is often referenced in North American news reports on oil prices, alongside the price of North Sea Brent crude (Wiki).

Headline photograph by Mariana Titus

Write Colonel Possum at colonelpossum@gmail.com for answers to your questions or to request e-mail updates on the market

Wednesday, March 30, 2011

Nevada Mining Taxes - Killing the Golden Goose


"Killing the Golden Goose" - a short-sighted action that destroys the profitability of an asset


Wōdnesdæg
Morning Miners!

It is 5:50 AM. Have a hot cup of hump day magic. Old Miner Woden is by the fire reading his favorite Aesop's Fable, "Killing The Goose That Laid the Golden Eggs." He started the fire this morning with a copy of Nevada Senate Joint Resolution 15...

Nevada Mining Taxes - Killing the Golden Goose


A faithful reader of the Report sent the ole Colonel a Las Vegas Sun link on the latest brouhaha over the future of Nevada mining taxes. Mining Editor Adella Harding wrote a good article on the same subject last night in the Elko Daily Free Press. Here are both links:

Democrats seek to repeal mining tax from the constitution (Anjeanette Damon, Las Vegas Sun, Monday, March 28, 2011, 6:35 p.m. PT)

Rhoads, Ellison oppose repeal of net proceeds tax (ADELLA HARDING Mining Editor, Elko Daily Free Press, March 29, 2011 4:55 pm PT)

The latest mining tax booger bear is Senate Joint Resolution 15 dreamed up by the prodigiously creative Senate Revenue Committee. It would essentially begin the process of repealing the constitutional protection the mining industry enjoys on its net proceeds tax.

Currently, the mining industry pays a 5 percent property tax on its mineral resources, but is allowed to deduct the cost of extracting and processing the minerals. Because the tax is protected by the state constitution, lawmakers are unable to fool with the the rate and they can't assess any other tax on minerals.

What's a poor legislator to do? How about removing the mining tax from the state constitution - that would allow them to impose a completely different tax or change the rate - Senate Joint Resolution 15 in a nutshell. Fortunately, it is hard to amend the constitution; the Legislature must pass it twice before it would go to voters for a final ratification.

If measure 15 weren't enough, the undaunted Revenue Committee introduced a second measure that would create a new Mining Oversight and Accountability Commission. These guys would write new tax legislation taking that duty away from the Nevada Tax Commission. Senate Majority Leader Steven Horsford, D-North Las Vegas, believes the tax commission has unfairly expanded the mining industry’s deductions. The new commission would also oversee environmental and safety regulations - maybe they can extend the General Moly Mt. Hope permitting process even longer!

The Harding article quotes a good summary of the situation by Elko County Commissioner Jeff Williams. He says legislative efforts to increase taxes from mining are "ruining the security of mining in all the rural counties. You can only go so far."

Talk about trying to kill the Silver State's golden goose! Oh, and that other goose that is expecting to lay a few molybdenum eggs on top of our Mt. Hope. Stay tuned, pardner.


Daily Market Roundup

Enough talk, let's walk the walk:

Eureka Miner's Index(EMI)

This morning the Eureka Miner's Index(EMI) is above-par at 451.92, up from yesterday's 390.26 and above the 1-month moving average of 379.53. The EMI continues to be down from the high set on January 4th and up from the March 15th low of 262.02 - a trend reversal may again be in the works.

The EMI gives us the market temperature for the factors that have the greatest impact on mining in Eureka County. The record high for the EMI is 816.78 set 01/04/2011; the low was set 6/7/2010 at 50.7. An EMI of 100 is the boundary between good lands and bad lands for the metals & miners.

200-day averages are used in the EMI to normalize current mining company share price and are updated monthly. Upper and lower trend lines are updated weekly.

Gold Value Index (GVI)

Our newly minted Gold Value Index (GVI) is below-par at 70.15, up from yesterday's 70.04. The 1-month moving average is 71.15. Today's Value Adjusted Gold Price (VAGP) is $1,701.7/oz.

The GVI gauges the value of gold in relation to oil, copper and silver independent of currency. Although gold prices have been on the rise, the GVI has been trending down since 6/7/2010 when it had a value of 100. These three commodities were chosen for relative value comparison because 1) oil is a common cost element for all miners, 2) copper has been a reliable proxy for global growth and 3) silver is a precious metal that now competes with gold for investment and as a hedge against fiat currencies.

The Value Adjusted Gold Price (VAGP) is a level that supports current oil, copper & oil prices based on historical commodity norms. If the daily COMEX gold price is below the VAGP, then gold is undervalued; if above, overvalued.

Daily Oil Watch

On February 1st we identified North Sea Brent crude oil as a good barometer for the developing crisis in the Middle East and North Africa. It is still above $100/bbl with a large but narrowing spread from the North American benchmark, Western Texas Intermediate or "Texas light sweet crude", traded on the NYMEX (see note 1). The Report normally follows the latter but will track both until things settle out in the region.

Here are the key front-month contracts as of this morning:

NYMEX light sweet crude $104.40
ICE North Sea Brent crude $115.10
Spread (ICE- NYMEX) = $10.70 (Yesterday $10.86)

Here are the July contracts* with a narrower spread:

NYMEX light sweet crude $105.45
ICE North Sea Brent crude $114.90
Spread (ICE- NYMEX) = $9.45 (Yesterday $9.35)

*(the most active front-month contracts are now May so we moved from June to July contracts for a 2-month look-ahead).

Although prices are off their crisis highs, we have $100+ Brent and NYMEX in July favoring higher oil prices through the summer. My December prediction that we would see NYMEX $100/bbl oil before the Fourth of July came true on February 23rd.

Eureka Outlook Dashboard

4-WD is ON - The miners are still in a real rough patch but Freeport may pull us out of the mud hole yet; The VIX or "fear index" is below 25; bellwether Freeport-McMoRan (FCX) moved above its 50-day and 100-day moving average today and is comfortably above its 200-day average of $44.85 (our new warning level, 03/04 update); 10-year Treasurys are safely below 4% preserving a low-interest rate environment.

The GREEN light is turned back on for Commodity Reflation with copper trading comfortably above $3.50/lb

The GREEN light is turned on for Stable Markets with the VIX below the 30 level (what's this?)

The YELLOW light is turned on for Inflation Watch as the Federal Reserve resumes buying Treasurys (aka QE2)

The GREEN light is turned back on for Investor Confidence as investment returns to the equity markets

The RED light is turned on our Fuel Gauge with oil above $100

A ORANGE light is ON for possible adverse regulation/legislation: Mine Safety Violations, Miner's claim fee, Miner taxation, Cortez Hills, mercury emissions , General Moly Mt. Hope Water Rights, U.S. House committee debates miner workplace safety bill, R&R Partners parts ways with Nevada Mining Association, Obama budget includes mining royalty , Mineral commission fights consolidation, Democrats seek to repeal mining tax from the constitution, Rhoads, Ellison oppose repeal of net proceeds tax

Otherwise, all lights are green on the Eureka Outlook Dashboard (upper right, what's this?)

Commodity Market Morning Update

NYMEX/COMEX: Oil is down $0.39 in early trading at $104.40 (May contract, most active); Gold is up $11.2 to $1428.70 (June contract, most active); Silver is up $0.643 to $37.630 (May contract, most active); Copper is down $0.0280 to $4.3185 (May contract, most active)

Western Molybdenum Oxide is $17.00; European Molybdenum Oxide is $16.72; LME cash seller is $17.26, LME moly 3-month seller's contract is $17.46

Stock Market Morning Update

The DOW is up 58.74 points to 12,337.90; the S&P 500 is up 5.85 at 1325.29

Miners are up:

Barrick (ABX) $51.25 up 1.10%
Newmont (NEM) $53.76 up 0.50%
US Gold (UXG) $8.88 up 3.62%
General Moly (Eureka Moly, LLC) (GMO) $5.41 up 0.56%
Thompson Creek (TC) $12.57 up 1.13%
Freeport-McMoRan (FCX) $54.96 up 1.22% (a bellwether mining stock spanning copper, gold & molybdenum)

The Steels are up (a "tell" for General Moly & Thompson Creek):

ArcelorMittal (MT) $36.79 up 1.18% - global steel producer
POSCO (PKX) $117.32 up 0.92% - South Korean integrated steel producer

The Eureka Miner's Grubstake Portfolio is is up 1.34% at $1,913,485.17 (what's this?).

Cheers,

Colonel Possum

Note 1 - West Texas intermediate (WTI), also known as Texas light sweet, is a type of crude oil used as a benchmark in oil pricing and is the underlying commodity of New York Mercantile Exchange's (NYMEX) oil futures contracts. The price of WTI is often referenced in North American news reports on oil prices, alongside the price of North Sea Brent crude (Wiki).

Headline photograph by Mariana Titus

Write Colonel Possum at colonelpossum@gmail.com for answers to your questions or to request e-mail updates on the market

Tuesday, March 29, 2011

$1,700 Gold or $3.90 Copper? Introducing VAGP


Morning Miners!

It is 5:53 AM. Ruby T just brewed a fresh pot - have a cup and it's time to do some space travel...

$1,700 Gold or $3.90 Copper? A Solar System Analogy

After all is said and done, the ole Colonel still believes that gold is the sun in the commodity solar system. As I told Mining Editor Adella Harding of the Elko Daily Free Press last week, "I think gold will always be the final arbitrator of value." Today, let's do a little planetary exploration to understand what I meant by that statement.

We've been talking a lot about the value of gold lately, not its dollar price which remains above $1,400/oz, but its "value" in relation to several key commodities. Last Thursday we chose oil, copper and silver to develop a "gold value index" or GVI to gauge the relative value of gold independent of currency. These three commodities were chosen for relative value comparison because 1) oil is a common cost element for all miners, 2) copper has been a reliable proxy for global growth and 3) silver is a precious metal that now competes with gold for investment and as a hedge against fiat currencies.

If you missed it, Adella kindly summarized my thoughts on gold and the GVI in last Friday's Elko Daily Press:

Gold prices slip after hitting record (ADELLA HARDING Mining Editor, Elko Daily Free Press, Friday, March 25, 2011 3:59 pm)

Here's the bottom line: although gold prices have been on the rise, the GVI has been trending down since 6/7/2010 when we gave it a value of 100. Today it is 70.0 up slightly from its low for 2011 of 69.40 set last Friday.

OK, gold is undervalued with respect to some commodities, so what? With the same data, you could also claim that commodities are presently overvalued with respect to gold. This brings us to the solar system analogy.

Folks used to think that the earth was at the center of the universe and the sun, planets and stars merrily rotated about our planet. Measuring gold's price movements relative to say copper is a bit like watching a golden sun rise and set on a red metal planet. Hey, copper has drawn much attention lately but I'm not willing to place it at the center of my universe! The ole Colonel maintains that copper is just another metallic planet (albeit a big'un like Jupiter) with an orbit still ruled by the laws of value imposed in a gold-centric solar system...

Value Adjusted Gold Price (VAGP)

If my solar system analogy is more confusing than helpful, let's try putting some numbers behind the concept. If you really believe copper, silver and oil are ruling the heavens it's not unreasonable to expect the "gold value gap" to eventually close with a rise in gold prices. Let's first establish a "fair value" for gold. I'm going to choose November 26th of last year because the gold/oil, gold/copper and gold/silver ratios were all closer to historical norms then than now:

November 26th, 2010

gold/oil ratio: 16.27 bbl/oz vs 13.53 bbl/oz (Friday close)
gold/copper ratio: 362 lbs/oz vs 323 lbs/oz (Friday close)
gold/silver ratio: 51.1 oz/oz vs 38.5 oz/oz (Friday close)

If we plug these into my gold value formulation we get a GVI of 83.57 (GVI_norm). If we say this is a "fair value" of gold closer to historical expectations, then present oil, copper and silver prices should support a much higher gold price. If we take Friday's closing price for COMEX gold at $1,426.2/oz then a "value adjusted price" can be calculated from the fair value GVI:

Value adjusted gold price (VAGP) = (GVI_norm/GVI)* gold price
Value adjusted gold price (VAGP) = (83.57/69.40)* $1,426.2/oz = $1717.4/oz

There, that should make the goldbugs happy - life in a "commodity-centric" universe. If you believe in the "gold-centric" version, everything is presently overvalued and will come falling back to proper orbit by the pull of the golden sun. Using the "more normal" 11/26/10 ratios,

$1,426.2/oz gold will support:

oil price: $87.66/bbl
silver price: $27.93/oz
copper price: $3.937/oz

It is somewhat reassuring that the above oil price falls right in the middle of the present range of fundamental support, $85-$90/bbl (i.e. without the Arab world crisis premium). There are some that are also seeing a silver correction on the horizon. Checkout this article in the London Telegraph:

Commodities column: Is the silver price heading for a fall? (Garry White, and Rowena Mason, Telegraph, 6:02PM BST 27 Mar 2011)

The authors use a similar argument on silver valuations but site the gold/silver ratio long term average to be closer to 40 (which is about where we are now). I prefer to use a ratio of 50 (or where we were last November) to represent "normal" because this was roughly the level prior to the 2008-2009 financial melt-down. Pick your poison.

The absolute numbers are less important than the trends - will gold pull commodity prices back down or will commodity prices lift gold up to close the "value gap"? I'm leaning towards the former case being a gold-centric guy, the answer may lie somewhere in between. Stay tuned, these are exciting times.

I plan to start updating the daily VAGP as well as the GVI to check our progress (see below).

Daily Oil Watch

On February 1st we identified North Sea Brent crude oil as a good barometer for the developing crisis in the Middle East and North Africa. It is still above $100/bbl with a large but narrowing spread from the North American benchmark, Western Texas Intermediate or "Texas light sweet crude", traded on the NYMEX (see note 1). The Report normally follows the latter but will track both until things settle out in the region.

Here are the key front-month contracts as of this morning:

NYMEX light sweet crude $103.77
ICE North Sea Brent crude $114.63
Spread (ICE- NYMEX) = $10.86 (Yesterday $10.94)

Here are the July contracts* with a narrower spread:

NYMEX light sweet crude $104.77
ICE North Sea Brent crude $114.12
Spread (ICE- NYMEX) = $9.35 (Yesterday $9.42)

*(the most active front-month contracts are now May so we moved from June to July contracts for a 2-month look-ahead).

Although prices are off their crisis highs, we have $100+ Brent and NYMEX in July favoring higher oil prices through the summer. My December prediction that we would see NYMEX $100/bbl oil before the Fourth of July came true on February 23rd.


Daily Market Roundup

Enough talk, let's walk the walk:

Eureka Miner's Index(EMI)

This morning the Eureka Miner's Index(EMI) is above-par at 390.26, down from yesterday's 448.62 and just above the 1-month moving average of 383.78. The EMI continues to be down from the high set on January 4th and up from the March 15th low of 262.02 - a trend reversal may again be in the works.

The EMI gives us the market temperature for the factors that have the greatest impact on mining in Eureka County. The record high for the EMI is 816.78 set 01/04/2011; the low was set 6/7/2010 at 50.7. An EMI of 100 is the boundary between good lands and bad lands for the metals & miners.

200-day averages are used in the EMI to normalize current mining company share price and are updated monthly. Upper and lower trend lines are updated weekly.

Gold Value Index (GVI)

Our newly minted Gold Value Index (GVI) is 70.04 up from yesterday's 69.73. The 1-month moving average is 71.25. Today's value adjusted gold price (VAGP) is $1,691.67

The GVI gauges the value of gold in relation to oil, copper and silver independent of currency. Although gold prices have been on the rise, the GVI has been trending down since 6/7/2010 when it had a value 0f 100. These three commodities were chosen for relative value comparison because 1) oil is a common cost element for all miners, 2) copper has been a reliable proxy for global growth and 3) silver is a precious metal that now competes with gold for investment and as a hedge against fiat currencies.

Eureka Outlook Dashboard

4-WD is ON - The miners are still in a real rough patch but Freeport may pull us out of the mud hole yet; The VIX or "fear index" is below 25; bellwether Freeport-McMoRan (FCX) moved above its 50-day and 100-day moving average today and is comfortably above its 200-day average of $44.85 (our new warning level, 03/04 update); 10-year Treasurys are safely below 4% preserving a low-interest rate environment.

The GREEN light is turned back on for Commodity Reflation with copper trading comfortably above $3.50/lb

The GREEN light is turned on for Stable Markets with the VIX below the 30 level (what's this?)

The YELLOW light is turned on for Inflation Watch as the Federal Reserve resumes buying Treasurys (aka QE2)

The GREEN light is turned back on for Investor Confidence as investment returns to the equity markets

The RED light is turned on our Fuel Gauge with oil above $100

A ORANGE light is ON for possible adverse regulation/legislation: Mine Safety Violations, Miner's claim fee, Miner taxation, Cortez Hills, mercury emissions , General Moly Mt. Hope Water Rights, U.S. House committee debates miner workplace safety bill, R&R Partners parts ways with Nevada Mining Association, Obama budget includes mining royalty , Mineral commission fights consolidation

Otherwise, all lights are green on the Eureka Outlook Dashboard (upper right, what's this?)

Commodity Market Morning Update

NYMEX/COMEX: Oil is down $0.21 in early trading at $103.77 (May contract, most active); Gold is down $2.0 to $1419.3 (June contract, most active); Silver is down $0.265 to $36.930 (May contract, most active); Copper is down $0.0280 to $4.3220 (May contract, most active)

Western Molybdenum Oxide is $17.00; European Molybdenum Oxide is $16.72; LME cash seller is $17.26, LME moly 3-month seller's contract is $17.46

Stock Market Morning Update

The DOW is down 8,32 points to 12,189.56; the S&P 500 is down 2.62 at 1307.57

Miners are down:

Barrick (ABX) $50.61 down 0.67%
Newmont (NEM) $52.94 down 0.62%
US Gold (UXG) $8.22 down 0.84%
General Moly (Eureka Moly, LLC) (GMO) $5.09 down 0.78%
Thompson Creek (TC) $12.25 down 1.69%
Freeport-McMoRan (FCX) $53.60 down 0.89% (a bellwether mining stock spanning copper, gold & molybdenum)

The Steels are mixed (a "tell" for General Moly & Thompson Creek):

ArcelorMittal (MT) $35.82 down 0.20% - global steel producer
POSCO (PKX) $115.08 up 0.66% - South Korean integrated steel producer

The Eureka Miner's Grubstake Portfolio is is down 0.62% at $1,848,949.19 (what's this?).

Cheers,

Colonel Possum

Note 1 - West Texas intermediate (WTI), also known as Texas light sweet, is a type of crude oil used as a benchmark in oil pricing and is the underlying commodity of New York Mercantile Exchange's (NYMEX) oil futures contracts. The price of WTI is often referenced in North American news reports on oil prices, alongside the price of North Sea Brent crude (Wiki).

Headline photograph by Mariana Titus (Eureka December 2005)

Write Colonel Possum at colonelpossum@gmail.com for answers to your questions or to request e-mail updates on the market

Monday, March 28, 2011

Oil, Gold & Copper Down, Freeport Up - Metals & Miners Weekly Roundup


Morning Miners!

It is 5:52 AM. Have a hot cup of Monday go-java. My dog Henry used to tell me, "Never fear the markets!" I sure miss that ole boy...

Oil & Metals Outlook

Last Monday we talked about how the recent global upheaval has created a tug-of-war of worry between supply disruption (prices up) and demand destruction (prices down). If someone says, "multiple melt-downs" Japanese nuclear reactors may come to mind or the spreading country-by-country unrest in the oil rich Arab world. One or both could happen or is happening already, nobody seems to know for sure.

What's a commodity price to do with all this uncertainty? Fundamental support for NYMEX oil is in the $85-$90/bbl range but it seems $100+/bbl oil will be with us for sometime (see Daily Oil Watch below). Further crisis escalation in North Africa and the Middle East could easily spike us to $120-$150/bbl. That was true last Monday and is still true today. Anti-government forces have made progress in retaking key towns over the weekend including the Libyan oil hub Ras Lanuf. NYMEX oil has dropped $1.68 to $103.72/bbl this morning. Good news but oil is still $100+/bbl.

Copper has been particularly resilient to all manner of shocks this year but took a hit this morning on the demand destruction side of the equation as reported by Bloomberg News:

Copper Falls Most in Two Weeks as Japanese Carmakers May Suspend Activity (Agnieszka Troszkiewicz, Bloomberg News, Mar 28, 2011 5:42 AM PT)

The gist of this article is concern that Japanese carmakers may have to suspend production at plants in China, potentially curbing demand for industrial metals. Even domestically, General Motors is shutting a plant in Louisina whose trucks depend on Japanese produced components. It is an interconnected world, pardner.

Copper is important to us because it has proven to be a reliable proxy for global growth. Although copper is down this morning, our bellwether miner Freeport-McMoRan has been showing signs of life lately. It closed above both its 50-day moving average Friday trending up since its March 15th low.

This Report's Eureka Miner's Index(EMI), which includes Freeport, also punched in a low on that day but has been moving up above its 1-month moving average recently (see below). Is this a spring renaissance for our miners that have been struggling since January?

Gold has been up in price but down in value for nearly 10 months as we showed with our Gold Value Index (GVI) introduced last week. Mining Editor Adella Harding included the Eureka Miner's GVI in her Friday article for the Elko daily Freepress:

Gold prices slip after hitting record (ADELLA HARDING Mining Editor, Elko Daily Free Press, Friday, March 25, 2011 3:59 pm)

We will update the GVI in a moment (see below) and talk about it more this week. Some additional thoughts will include developing a "fair value" price for gold given the price action of key commodities - oil, copper and silver.

Here's an interesting piece in Mineweb on some on how gold is likely to outperform base metals in the second half of the year but may see headwinds if there is a U.S. interest rate hike:

Gold to top out around $1,500 in Q4 2011 – SocGen (Rhona O'Connell, Mineweb, Friday , 25 Mar 2011)

Finally, European moly oxide fell below its lower tend-line last week falling to $16.72/lb. Although this is not a big drop from $17 territory, we were looking for movement toward $20/lb before all hell broke loose. The up-trend has been a good sign since last July; breaking it is a bearish indication.

It's a day-by-day headline-driven world my friend.

Eureka Miner's Index (EMI)

The broader markets are now open and it looks like copper giant Freeport-McMoRan (FCX) is up on a day that the red metal opened down - hard to stop a red metal bull, pardner.

The Eureka Miner's Index (EMI) gives us the market temperature for the factors that have the greatest impact on mining in Eureka County. Below is a chart of the EMI at Friday's close. The magenta line shows the EMI; a composite of three benchmark miners, key oil and metal prices, the 10-year Treasury rate and market volatility (.VIX). A 1-month moving average is given by the blue line (a larger, more readable chart can be found near the bottom of the blog page):


This morning the Eureka Miner's Index(EMI) is above-par at 448.82, down slightly from from Friday's close at 454.47 but above the 1-month moving average of 387.62. The EMI continues to be down from the high set on January 4th, it set a new 2011 low on March 15th. A trend reversal may be in the works.

The record high for the EMI is 816.78 set 01/04/2011; the low was set 6/7/2010 at 50.7. An EMI of 100 is the boundary between good lands and bad lands for the metals & miners relevant to Eureka County.

200-day averages are used in the EMI to normalize current mining company share price and are updated monthly. Upper and lower trend lines are updated weekly.

Gold Value Index (GVI)

Our newly minted Gold Value Index (GVI) is 69.73 above Friday's close of 69.40 which was a new low for 2011. The 1-month moving average is 71.36 and the GVI high for 2011 is 78.35.

The GVI gauges the value of gold in relation to oil, copper and silver independent of currency. Although gold prices have been on the rise, the GVI has been trending down since 6/7/2010 when it had a value 0f 100. These three commodities were chosen for relative value comparison because 1) oil is a common cost element for all miners, 2) copper has been a reliable proxy for global growth and 3) silver is a precious metal that now competes with gold for investment and as a hedge against fiat currencies.

Below is a chart of the GVI at Friday's close. The magenta line shows the GVI, a 1-month moving average is given by the blue line and the dotted line represents a "fair value" for a commodity-based valuation based on historical data (a larger, more readable chart can be found near the bottom of the blog page):


Daily Oil Watch

On February 1st we identified North Sea Brent crude oil as a good barometer for the developing crisis in the Middle East and North Africa. It is still above $100/bbl with a large but narrowing spread from the North American benchmark, Western Texas Intermediate or "Texas light sweet crude", traded on the NYMEX (see note 1). The Report normally follows the latter but will track both until things settle out in the region.

Here are the key front-month contracts as of this morning:

NYMEX light sweet crude $103.72
ICE North Sea Brent crude $114.66
Spread (ICE- NYMEX) = $10.94 (Last Friday $10.38)

Here are the July contracts* with a narrower spread:

NYMEX light sweet crude $104.80
ICE North Sea Brent crude $114.22
Spread (ICE- NYMEX) = $9.42 (Last Friday $9.03)

* (the most active front-month contracts are now May so we moved from June to July contracts for a 2-month look-ahead).

Although prices are off their crisis highs, we have $100+ Brent and NYMEX in July favoring higher oil prices through the summer. My December prediction that we would see NYMEX $100/bbl oil before the Fourth of July came true on February 23rd.

Oil & Copper Correlations with Gold

Oil & copper correlations with gold give us insight into what may happen next for the metals & miners. With supply and demand fundamentals returning to the commodity space, diminishing correlations between key commodities are less alarming but trends should still be carefully monitored especially with spiking oil prices.

Here are the latest correlations given this morning's NYMEX/COMEX trading:

Oil/Au correlation +0.7171 (1-month) +0.8215 (3-month)
Cu/Au correlation +0.4056 (1-month) -0.1971 (3-month)
Cu/Oil correlation +0.1054 (1-month) -0.3291 (3-month)

Here are the numbers from the last roundup (3/21/2011):

Oil/Au correlation +0.8522 (1-month) +0.7814 (3-month)
Cu/Au correlation +0.0157 (1-month) -0.2128 (3-month)
Cu/Oil correlation -0.2750 (1-month) -0.3183 (3-month)

We now have more positive than negative correlations. Oil and gold continue to move in a strong positive direction. Copper versus gold & copper versus oil have both stepped outside their inversions (i.e. both one-month & three-month value correlations are negative) as their 1-month correlations trend more positive. The metals & miners tend to do best when all correlations are positive.

According to my March models (see bottom of blog page): oil is presently overvalued with respect to gold by +4.43-standard deviations and copper is overvalued by +0.69-standard deviations. Copper is presently under-valued with respect to oil by -0.66-standard deviations.

One way to visualize these correlations over time is to plot the "near-term" 3-month versus the "short-term" 1-month correlations (aka "rho") as shown below in a graph of oil versus gold and copper versus gold. The blue line indicates the correlation trajectory since October 1st; the magenta line is more recent data (ref: China to the Rescue?):


In the case of oil versus gold, we start out on 10/1/10 in the "+,-" or "yellow" quadrant and move upward until both are positively correlated (i.e. in the "+,+" or "green" quadrant). Copper correlated positively faster than oil last fall and has was initially in the green quadrant longer. Correlation data in this region is typically considered bullish. After a brief venture into the "-,+" quadrant, the return of oil vs gold to the "+,+" side is bullish; the movement of copper vs gold into the "-,-" inversion region was a bearish development but its continuing trend into the "+,- region is encouraging. Stay tuned.

Gold:Oil, Oil:Copper & Gold:Copper Ratios

The Report has been tracking the stability of the gold:oil, oil:copper & gold:copper ratios. Although they ended last year rock solid (<3% variation, 1-standard deviation/mean) the ratios have diverged. The period of divergence is what prompted my January 14th comment to Adella Harding, Elko Daily Free Press, "The recent divergence of our lustrous friend [gold] from copper and oil...may signal a near-term correction for the overall metals and mining sector.". The mining sector remains in correction except gold miners are getting some lift with rising gold prices.

Once the ratios exceed 3% error, they become less useful in predicting the price moves of one commodity with respect to the another in the ratio pair.

For the past 3-months we have these statistics given this mornings' numbers:

Gold:Oil ratio

mean 14.793 bbl/oz
variation > 3.0% limit at 5.07% (1-standard deviation/mean)

Oil:Copper ratio

mean 21.43 lbs/bbl
variation > 3.0% limit at 8.32% (1-standard deviation/mean)

Gold:Copper ratio

mean 315.9 lbs/oz
variation > 3.0% limit at 4.00% (1-standard deviation/mean)

Weekly Molybdenum Roundup

Spot prices for molybdenum oxide remain in $17/lb territory out West but dipped below to $16.72/lb in Europe breaking below a its lower trend-line established since July 2010. Western and Euro moly spot prices are now in a very light contango with both 3-month and 15-month London Metal Exchange (LME) seller contracts. (contango occurs when the price of a commodity for future delivery is higher than the spot price, or a far future delivery price is higher than a nearer future delivery; backwardation is the opposite of contango).

The 3-month seller is at $17.01/lb is comfortably above the Colonel's mid-range moly price target for 2010 of $15.71/lb but below my target of $20.21/lb for 2011. The Report will give moly prices a "yellow-green" light on the Eureka Outlook Dashboard for now because I do believe we could see much higher prices this year although the Middle East and Japan crisis must be watched closely. There is an excellent analysis of the supply/demand argument for $20+/lb moly provided by General Moly's Seth Foreman in the General Moly Update.

Here is a detailed pricing summary for last week:

Western Moly Oxide $17.00/lb (the price tracked by Base Metals on the General Moly Website)

Moly Oxide, Europe (Mo Drummed Molydbic Oxide EU) $16.72/lb (the price reported in the Metals Bulletin)

LME Futures Contracts

LME cash seller is at $37,050/metric ton $16.81/lb

3-Month (Buyer) $36,250/metric ton $16.44/lb
3-Month (Seller) $37,500/metric ton $17.01/lb

15-Month (Buyer) $37,550/metric ton $17.03/lb
15-Month (Seller) $38,550/metric ton $17.49/lb

Here is a 1-year chart of the LME 3-month contract (seller):


Daily Market Roundup

Enough talk, let's walk the walk:

Eureka Outlook Dashboard

4-WD is ON - The miners are still in a rough patch but there are some signs of improvement; The VIX or "fear index" is below 25; bellwether Freeport-McMoRan (FCX) is now above both 50-day and 150-day moving averages and above its 200-day average of $44.85 (our new warning level, 03/04 update); 10-year Treasurys are safely below 4% preserving a low-interest rate environment.

The GREEN light is turned back on for Commodity Reflation with copper trading comfortably above $3.50/lb

The GREEN light is turned on for Stable Markets with the VIX below the 30 level (what's this?)

The YELLOW light is turned on for Inflation Watch as the Federal Reserve resumes buying Treasurys (aka QE2)

The GREEN light is turned back on for Investor Confidence as investment returns to the equity markets

The RED light is turned on our Fuel Gauge with oil above $100

A ORANGE light is ON for possible adverse regulation/legislation: Mine Safety Violations, Miner's claim fee, Miner taxation, Cortez Hills, mercury emissions , General Moly Mt. Hope Water Rights, U.S. House committee debates miner workplace safety bill, R&R Partners parts ways with Nevada Mining Association, Obama budget includes mining royalty , Mineral commission fights consolidation

Otherwise, all lights are green on the Eureka Outlook Dashboard (upper right, what's this?)

Commodity Market Morning Update

NYMEX/COMEX: Oil is down $1.68 in early trading at $103.72 (May contract, most active); Gold is down $13.2 to $1413.0 (April contract, most active); Silver is down $0.389 to $36.660 (May contract, most active); Copper is down $0.0610 to $4.3580 (May contract, most active)

Western Molybdenum Oxide is $17.00; European Molybdenum Oxide is $16.72; LME moly 3-month seller's contract is $17.01, LME cash seller is $16.81

Stock Market Morning Update

The DOW is up 37.84 points to 12,259.56; the S&P 500 is up 4.08 at 1317.88

Miners are mixed:

Barrick (ABX) $51.38 down 0.25%
Newmont (NEM) $53.83 down 0.24%
US Gold (UXG) $8.39 down 1.06%
General Moly (Eureka Moly, LLC) (GMO) $5.24 down 0.38%
Thompson Creek (TC) $12.58 up 0.08%
Freeport-McMoRan (FCX) $55.31 up 1.39% (a bellwether mining stock spanning copper, gold & molybdenum)

The Steels are up (a "tell" for General Moly & Thompson Creek):

ArcelorMittal (MT) $36.05 up 0.84% - global steel producer
POSCO (PKX) $114.22 up 0.55% - South Korean integrated steel producer

The Eureka Miner's Grubstake Portfolio is is down 0.15% at $1,873,665.19 (what's this?).

Cheers,

Colonel Possum

Note 1 - West Texas intermediate (WTI), also known as Texas light sweet, is a type of crude oil used as a benchmark in oil pricing and is the underlying commodity of New York Mercantile Exchange's (NYMEX) oil futures contracts. The price of WTI is often referenced in North American news reports on oil prices, alongside the price of North Sea Brent crude (Wiki).

Headline photograph by Mariana Titus

Write Colonel Possum at colonelpossum@gmail.com for answers to your questions or to request e-mail updates on the market

Friday, March 25, 2011

Gartman, RBS Thoughts on Gold & Silver


Morning Miners!

It is 5:54 AM. Have a cup of delicious Raine's Red Label TGIF. Let's scratch our heads on gold & silver after Thursday's whirlwind...

Gold & Silver New Records

COMEX gold and silver both made new records yesterday. Gold started the race at 10:30 ET but silver quickly responded to break above $38/oz pegging $38.180/oz. COMEX gold inched out its March 7th watermark rising to a peak of $1,448.60/oz. The gold/silver ratio for the two records is at multi-decade low of 37.94. The steady decline in this closely watched ratio has not missed the attention of two savvy investors as we'll discover in a moment.

NYMEX oil came within a few cents of its latest record but fell back before making the score.

Let's update our record book for the big three metals together with NYMEX and ICE Brent crude:

COMEX Gold $1448.60/oz 10:30 ET 03/24/2011, April contract most active (new)
COMEX Silver $38.180/oz 10:50 ET 03/24/2011, May contract most active (new)
COMEX Copper $4.6375/lb 06:15 ET 02/04/2011, March contract most active
NYMEX WTI Crude $106.95/bbl 08:05 ET, 03/07/2011, April contract most active
ICE Brent crude $119.79/bbl 02:45 ET 02/24/2011, April contract most active

Gartman, RBS Thoughts on Gold & Silver

Kitco News carried Dennis Gartman's latest thoughts on gold, silver and equities in a "Market Nugget." Gartman is the author of the Gartman Letter and one of the Colonel's favorite metallic prognosticators.

Market Nuggets: Gartman: Silver Outperformance Vs. Gold Bodes Well For Equities (Kitco News, Market Nuggets, 3/25/2011)

Market Nuggets tend to be fleeting on this website so I'll try to boil down the message. Steve Cortes, a CNBC contributor and one of my other favorites, apparently showed Mr. Gartman a chart that indicated equities historically do well when the gold/silver ratio compresses and less well when it expands. Mr. Gartman says, when silver outperforms gold, as has been the case lately, "we must err bullishly of equities," and conversely when silver loses relative to gold, "we’ll err bearishly instead."

Mr. Gartman concludes, "We have long argued that silver’s strength relative to gold tells a story of economic growth, for silver is both industrial and precious, and the gold/silver ratio moves in silver’s favor when industrial activity is high and rising."

On June 7th 2010, arguably the worst day for the metals & miners, the gold/silver ratio was 68; today it is 38. But, according to the latest RBS Commodity Companion publication, the fortunes of gold & silver may change as we look towards the next several years. There is an informative article about this voluminous document on Mineweb this morning:

Aluminium, copper, PGMS to perform over next 3 years - RBS
(Rhona O'Connell, Mineweb, 24 Mar 2011)

Th gist of the summary is that RBS prefers aluminium, copper, platinum and palladium to bulk commodities and silver looking out to 2014. According to RBS, "gold, silver, coal and iron ore are now richly priced and set to fade." They are particularly down on silver, "Silver is the least preferred metal."

If RBS is correct we may see a drop in gold prices with a steeper decline in silver bringing the gold/silver ratio back to more typical levels seen before the collapse of Lehman Brothers, say 50-56. In that light $1400/oz gold would support $25-$28/oz silver prices. Pick your own numbers, pardner and stay tuned...they may also be wrong.

Daily Oil Watch

On February 1st we identified North Sea Brent crude oil as a good barometer for the developing crisis in the Middle East and North Africa. It is still above $100/bbl with a large but narrowing spread from the North American benchmark, Western Texas Intermediate or "Texas light sweet crude", traded on the NYMEX (see note 1). The Report normally follows the latter but will track both until things settle out in the region.

Here are the key front-month contracts as of this morning:

NYMEX light sweet crude $105.33
ICE North Sea Brent crude $115.71
Spread (ICE- NYMEX) = $10.38 (Yesterday $8.69)

Here are the July contracts* with a narrower spread:

NYMEX light sweet crude $106.29
ICE North Sea Brent crude $115.32
Spread (ICE- NYMEX) = $9.03 (Yesterday $7.76)

*(the most active front-month contracts are now May so we moved from June to July contracts for a 2-month look-ahead).

Although prices are off their crisis highs, we have $100+ Brent and NYMEX in July favoring higher oil prices through the summer. My December prediction that we would see NYMEX $100/bbl oil before the Fourth of July came true on February 23rd.


Daily Market Roundup

Enough talk, let's walk the walk:

Eureka Miner's Index(EMI)

This morning the Eureka Miner's Index(EMI) is above-par at 474.87, up from yesterday's 446.76 and above the 1-month moving average of 386.72. The EMI continues to be down from the high set on January 4th and up from the March 15th low of 262.02 - a trend reversal may again be in the works.

The EMI gives us the market temperature for the factors that have the greatest impact on mining in Eureka County. The record high for the EMI is 816.78 set 01/04/2011; the low was set 6/7/2010 at 50.7. An EMI of 100 is the boundary between good lands and bad lands for the metals & miners.

200-day averages are used in the EMI to normalize current mining company share price and are updated monthly. Upper and lower trend lines are updated weekly.

Gold Value Index (GVI)

Our newly minted Gold Value Index (GVI) is 69.45 below yesterday's 69.62 setting a new low for 2011. The 1-month moving average is 71.70.

The GVI gauges the value of gold in relation to oil, copper and silver independent of currency. Although gold prices have been on the rise, the GVI has been trending down since 6/7/2010 when it had a value 0f 100. These three commodities were chosen for relative value comparison because 1) oil is a common cost element for all miners, 2) copper has been a reliable proxy for global growth and 3) silver is a precious metal that now competes with gold for investment and as a hedge against fiat currencies.

Eureka Outlook Dashboard

4-WD is ON - The miners are still in a real rough patch but Freeport may pull us out of the mud hole yet; The VIX or "fear index" is below 25; bellwether Freeport-McMoRan (FCX) moved above its 50-day and 100-day moving average today and is comfortably above its 200-day average of $44.85 (our new warning level, 03/04 update); 10-year Treasurys are safely below 4% preserving a low-interest rate environment.

The GREEN light is turned back on for Commodity Reflation with copper trading comfortably above $3.50/lb

The GREEN light is turned on for Stable Markets with the VIX below the 30 level (what's this?)

The YELLOW light is turned on for Inflation Watch as the Federal Reserve resumes buying Treasurys (aka QE2)

The GREEN light is turned back on for Investor Confidence as investment returns to the equity markets

The RED light is turned on our Fuel Gauge with oil above $100

A ORANGE light is ON for possible adverse regulation/legislation: Mine Safety Violations, Miner's claim fee, Miner taxation, Cortez Hills, mercury emissions , General Moly Mt. Hope Water Rights, U.S. House committee debates miner workplace safety bill, R&R Partners parts ways with Nevada Mining Association, Obama budget includes mining royalty , Mineral commission fights consolidation

Otherwise, all lights are green on the Eureka Outlook Dashboard (upper right, what's this?)

Commodity Market Morning Update

NYMEX/COMEX: Oil is down $0.27 in early trading at $105.33 (May contract, most active); Gold is down $0.7 to $1434.2 (April contract, most active); Silver is up $0.105 to $37.480 (May contract, most active); Copper is up $0.0275 to $4.4520 (May contract, most active)

Western Molybdenum Oxide is $17.00; European Molybdenum Oxide is $16.75; LME cash seller is $16.81, LME moly 3-month seller's contract is $17.01

Stock Market Morning Update

The DOW is up 29.67 points to 12,200.23; the S&P 500 is up 2.83 at 1312.49

Miners are mixed:

Barrick (ABX) $51.81 up 0.39%
Newmont (NEM) $54.73 up 0.39%
US Gold (UXG) $8.69 up 1.76%
General Moly (Eureka Moly, LLC) (GMO) $5.31 down 1.67%
Thompson Creek (TC) $12.53 down 0.24%
Freeport-McMoRan (FCX) $54.88 up 0.99% (a bellwether mining stock spanning copper, gold & molybdenum)

The Steels are up (a "tell" for General Moly & Thompson Creek):

ArcelorMittal (MT) $36.26 up 0.19% - global steel producer
POSCO (PKX) $112.94 up 1.15% - South Korean integrated steel producer

The Eureka Miner's Grubstake Portfolio is is up 0.47% at $1,888,777.95 (what's this?).

Cheers,

Colonel Possum

Note 1 - West Texas intermediate (WTI), also known as Texas light sweet, is a type of crude oil used as a benchmark in oil pricing and is the underlying commodity of New York Mercantile Exchange's (NYMEX) oil futures contracts. The price of WTI is often referenced in North American news reports on oil prices, alongside the price of North Sea Brent crude (Wiki).

Headline photograph by Mariana Titus (Eureka December 2005)

Write Colonel Possum at colonelpossum@gmail.com for answers to your questions or to request e-mail updates on the market

Thursday, March 24, 2011

Eureka Miner's 2-Year Anniversary; Silver Breaks $38


Þūnresdæg
Morning Miners!

It is 5:49 AM. Have a cup of Thor's Day Thunder. I can hardly be too upset with our favorite Norseman this morning. His heart was in the right place when he tried to bake a cake for the Eureka Miner's second anniversary. Either there was too much yeast in the pan or the thunderbolt was too hot but we have more cake on the walls of the break room than on our table. We'll just have to settle for a hot cup of Thor's famous java, happy anniversary miners!

The Eureka Miner's 2-Year Anniversary

This will be the four hundred and fifty ninth morning market report since we went on the air March 24th 2009. That was 2-weeks after the worst drop in the stock markets that most living folks remember. Copper was a $1.80/lb, gold was $940/oz and T. Boone Pickens had just predicted that oil would see $60/bbl before $40/bbl. The average price for NYMEX crude at that time was $42/bbl. General Moly stock closed at $1.23 and Barrick stood at $32.06. There were grave concerns about global recovery and further crumbling of markets.

That was then, this is now. Copper is up a healthy $4.44+/lb, gold is trading above $1400+/oz and COMEX silver just set a new record at an eye-popping $38.180/oz. Of course, NYMEX oil is a chilling $105+/bbl taking some of the fun out of the party.

In May of 2009, the Report put together a portfolio of 12 stocks that directly or indirectly impact mining in Eureka County, Nevada. The ole Colonel gave the readers one million dollars of play money to invest and today the Eureka Miner's Grubstake Portfolio is worth $1,882,878.82. General Moly is trading today at $5.38 and Barrick is standing tall at $51.78. I'd say we've come a long way together, pardner.

Some fun facts about the Eureka Miner's Market Report

When I started the Report, my intent was to provide Eurekans a summary of how metal and equity markets fare every morning, especially those that influence the mining concerns in our area. Surprisingly, there has been considerable interest in what Eureka is up to beyond our county borders. Here are some fun facts:

The Report has had 4,880 domestic and international visitors.

92 countries and territories have checked out the Eureka Miner. The top five as a percent of total visits are:

United States 88.4%
Canada 2.8%
United Kingdom 2.0%
India 0.9%
Australia 0.8%

Every state and territory in the U.S.A. has dropped by for an occasional read. The top five are:

Nevada 30.4%
California 17.9%
Colorado 7.6%
New York 5.4%
Virginia 3.6%

Over two years the average reader of the report has spent 3 minutes and 35 seconds checking out the latest market news. Our biggest day was 208 readers; lately, the average traffic is about 50 readers per day.

The internet traffic breaks out like this:

Direct traffic 37.9%
Referring sites 37.3%
Search engine 24.9%

The ole Colonel also places an occasional beer bet with the readers on commodity and stock prices. Here's who owes who:

2010 Prediction Accuracy 77.8%
2010 Score: 15 Bets; Colonel 7 beers, Readers 2, Rollovers 6

2009 Prediction Accuracy 71.4%
2009 Score: 14 Bets; Colonel 10 beers, Readers 4, Rollovers 0

This year I predicted we'd see $100/bbl oil, $36/lb silver and $1,570/oz gold before the Fourth of July. We still have to get gold in the bag but there are a lot of market days left before Independence day.

Thank you all for you faithful readership, contributions and support!

I would also like to thank my sweetheart Mariana for taking all the terrific headline photographs for the Report. Mariana Titus has been photographing the folks and environs of Eureka since the mid-1980s.


Daily Oil Watch

On February 1st we identified North Sea Brent crude oil as a good barometer for the developing crisis in the Middle East and North Africa. It is still above $100/bbl with a large but narrowing spread from the North American benchmark, Western Texas Intermediate or "Texas light sweet crude", traded on the NYMEX (see note 1). The Report normally follows the latter but will track both until things settle out in the region.

Here are the key front-month contracts as of this morning:

NYMEX light sweet crude $105.99
ICE North Sea Brent crude $114.68
Spread (ICE- NYMEX) = $8.69 (Yesterday $10.26)

Here are the July contracts* with a narrower spread:

NYMEX light sweet crude $106.61
ICE North Sea Brent crude $114.37
Spread (ICE- NYMEX) = $7.76 (Yesterday $9.10)

*(the most active front-month contracts are now May so we moved from June to July contracts for a 2-month look-ahead).

Although prices are off their crisis highs, we have $100+ Brent and NYMEX in July favoring higher oil prices through the summer. My December prediction that we would see NYMEX $100/bbl oil before the Fourth of July came true on February 23rd.


Daily Market Roundup

Enough talk, let's walk the walk:

Eureka Miner's Index(EMI)

This morning the Eureka Miner's Index(EMI) is above-par at 446.76, up from yesterday's 362.77 and above the 1-month moving average of 384.45. The EMI continues to be down from the high set on January 4th and up from the March 15th low of 262.02

The EMI gives us the market temperature for the factors that have the greatest impact on mining in Eureka County. The record high for the EMI is 816.78 set 01/04/2011; the low was set 6/7/2010 at 50.7. An EMI of 100 is the boundary between good lands and bad lands for the metals & miners.

200-day averages are used in the EMI to normalize current mining company share price and are updated monthly. Upper and lower trend lines are updated weekly.

Eureka Outlook Dashboard

4-WD is ON - The miners are still in a real rough patch; The VIX or "fear index" is just below 25; bellwether Freeport-McMoRan (FCX) is just above its 50-day and 100-day moving average and above its 200-day average of $44.85 (our new warning level, 03/04 update); 10-year Treasurys are safely below 4% preserving a low-interest rate environment.

The GREEN light is turned back on for Commodity Reflation with copper trading comfortably above $3.50/lb

The GREEN light is turned on for Stable Markets with the VIX below the 30 level (what's this?)

The YELLOW light is turned on for Inflation Watch as the Federal Reserve resumes buying Treasurys (aka QE2)

The GREEN light is turned back on for Investor Confidence as investment returns to the equity markets

The RED light is turned on our Fuel Gauge with oil above $100

A ORANGE light is ON for possible adverse regulation/legislation: Mine Safety Violations, Miner's claim fee, Miner taxation, Cortez Hills, mercury emissions , General Moly Mt. Hope Water Rights, U.S. House committee debates miner workplace safety bill, R&R Partners parts ways with Nevada Mining Association, Obama budget includes mining royalty , Mineral commission fights consolidation

Otherwise, all lights are green on the Eureka Outlook Dashboard (upper right, what's this?)

Commodity Market Morning Update

NYMEX/COMEX: Oil is up $0.24 in early trading at $105.99 (May contract, most active); Gold is up $1.0 to $1439.0 (April contract, most active); Silver is up $0.457 to $37.665 (May contract, most active); Copper is down $0.0110 to $4.4175 (May contract, most active)

Western Molybdenum Oxide is $17.00; European Molybdenum Oxide is $16.75; LME moly 3-month seller's contract is $17.01, LME cash seller is $16.81

Stock Market Morning Update

The DOW is up 32.70 points to 12,118.72; the S&P 500 is up 2.19 at 1299.73

Miners are mixed:

Barrick (ABX) $51.78 down 0.48%
Newmont (NEM) $54.75 down 0.15%
US Gold (UXG) $8.59 down 0.23%
General Moly (Eureka Moly, LLC) (GMO) $5.38 down 1.82%
Thompson Creek (TC) $12.69 down 0.31%
Freeport-McMoRan (FCX) $54.26 down 1.13% (a bellwether mining stock spanning copper, gold & molybdenum)

The Steels are mixed (a "tell" for General Moly & Thompson Creek):

ArcelorMittal (MT) $35.61 up 0.37% - global steel producer
POSCO (PKX) $111.20 down 1.11% - South Korean integrated steel producer

The Eureka Miner's Grubstake Portfolio is is down 0.21% at $1,882,878.82 (what's this?).

Cheers,

Colonel Possum

Note 1 - West Texas intermediate (WTI), also known as Texas light sweet, is a type of crude oil used as a benchmark in oil pricing and is the underlying commodity of New York Mercantile Exchange's (NYMEX) oil futures contracts. The price of WTI is often referenced in North American news reports on oil prices, alongside the price of North Sea Brent crude (Wiki).

Headline photograph by Mariana Titus (Eureka December 2005)

Write Colonel Possum at colonelpossum@gmail.com for answers to your questions or to request e-mail updates on the market