
Looking at the world from a different perspective
Salt Lake, Utah (circa 1980s)
Salt Lake, Utah (circa 1980s)
Friday, September 7, 2018 AM
Chinese Yuan Reversal Is Bullish Gold (Richard Baker, Kitco News, 8/27/2018)
The Mystery of Gold and the Chinese Yuan (Richard Baker, Kitco News, 7/31/2018)
SPECIAL NOTE: Sadly, Pete Edera passed over the rainbow this week. Pete was from one of Eureka's legacy families going back to 1880s. He was a friend of this report and provided insightful historical information about Eureka's early mining days. He will be missed by all. Pete’s funeral will be Saturday Sept. 8th at 11 am. at the Opera House in Eureka, Nevada.
Morning Miners!
The monthly jobs report for August was delivered by the early bird at 5:30 a.m. Eureka time. For the most part, it was encouraging and exceeded economists estimates. 201,000 jobs were added in August versus an expectation of 190,000 with headline unemployment steady at 3.9% - the lowest level since 1969. There were downward revisions for June and July's numbers but the 3-month average is a healthy 185,000 jobs per month. One negative was a decrease in participation rate notching down 0.2% to 62.7% (coach potato factor, there really are a lot of jobs out there).
Perhaps the most important number is the monthly increase in average hourly earnings - up 0.4% for 2.9% year-over-year. Is it time to ask your boss for a raise?
What does this mean for gold prices?
A healthy economy that is still adding jobs won't discourage the U.S. Federal Reserve from further interest rate increases - a potential headwind for the Lustrous One. However, accelerating wage growth could spark inflation (please see Inflation Watch below). Remember it is the difference between interest rates less inflation that drives gold price...at least in normal times. Comex gold dipped briefly below the $1,200-level on the report but quickly recovered to presently trade at $1,202.5 per ounce.
There is another factor in the mix: Chinese and emerging market stocks are in bear territory and their currencies are in pain. My full explanation provided to the Kitco's Weekly Gold Survey this morning:
The currencies of the world's largest consumers of gold and silver together with the ratio of gold-to-silver are key metrics to monitor for future direction.
I believe the most important news for precious metals this week is not today's stronger-than-expected labor report but the gold-to-silver ratio (GSR). Yesterday, one ounce of Comex gold bought 84.8 ounces of silver - a level higher than March 2016 and approaching a peak set during the financial crisis of 90.5 ounces per ounce (November 2008).
A GSR that exceeds the 80-level is often a sign that a reversal of fortunes is in the winds for precious metals. I checked this hypothesis with a gold/silver trader in Mumbai this week. He said that silver in $14 per ounce territory is a buy if the Modi government steps in to support the falling rupee (USD/INR). Like the Chinese yuan, the rupee has been in decline since April and gold has been tightly correlated with the former. The Chinese yuan appears to be stabilizing around 6.80-6.85 (USD/CNY) and gold is demonstrating resilience around $1,200 per ounce.
My updated currency model for gold, which includes the euro, Japanese yen and yuan, suggests a Comex range of $1,197 to $1,225 per ounce for a yuan approaching 6.85. I expect it likely that gold will tick up to $1,210 per ounce next week near mid-range. Embattled silver will initially creep ahead to $14.3 per ounce territory. My outlook for both is bullish, the lows are in for 2018. [see Weekly Summary Chart]
Here is a chart of the gold-to-silver ratio (GSR, click on image for larger size)):

For background on the gold/yuan connection, please read my latest Kitco News commentaries...
Chinese Yuan Reversal Is Bullish Gold (Richard Baker, Kitco News, 8/27/2018)
The Mystery of Gold and the Chinese Yuan (Richard Baker, Kitco News, 7/31/2018)
This mornings' price action:
Comex gold (12/18 contract) $1,202.5 per ounce,
Comex silver (12/18 contract) $14.215 per ounce
Comex copper (12/18/ contract) $2.6475 per pound
Importantly, the correlation of Comex gold price and Chinese yuan (USD/CNY) continues as the Japanese yen (USD/JPY) and euro (EUR/USD) now play a part too. You don't need to understand all the statistical gibberish on these charts to see the closeness of gold price to a gold model based on these currencies (note shaded 3-month area, click on plots for larger image):

"So goes the yuan goes, so goes gold."
Have a relaxing weekend - you deserve it!

Inflation Watch
Inflation expectations made a new 2018 high April 23rd above a trend lines of higher lows (dotted lines, click on chart for larger size). After a sharp dip last on May 29th, expectations recovered, then moved more or less sideways. Interesting to note that lower-highs from April 23rd (solid blue line) are about to intersect higher-lows (dashed blue line) - is inflation poised to break out? The hot hourly wage increase in August may say yes.

10-year Inflation Expectations
Note: In the above chart inflation expectations peaked at 2.14% February 2nd but were surpassed April 23rd at 2.18%. May 29th dramatically broke the trend line of higher-lows falling to 2.04%. This decline recovered to 2.12%, retreated and is 2.09% this Wednesday. New trend line of higher-lows is shown in dark blue; older trend line, in light blue. Note that present trend now extends to the June 21, 2017 low.
Interest rates and inflation numbers going forward are greatly influenced by central bank policy worldwide. This Kitco commentary discusses what some of the moving parts are as well as useful indicators - watch the U.S. Dollar Index (DXY) and euro/yen cross rate:
The Gartman Gold Trade Revisited (Kitco News, 2/14/2018)
Several of the charts in this column are updated below.

Old Glory
Eureka, Nevada
Scorecard
Here's a scorecard on where we stand with some of our favorite metals.
Intraday highs on the Comex futures exchange:
Gold $1,370.5 per ounce January 25, 2018 (April 2018 contract)
Silver $18.160 per ounce September 8, 2017 (Continuous chart))
Copper $3.3335 per pound ($7,349 per tonne) December 28, 2017 (May 2018 contract)
Intraday lows on the Comex exchange:
Gold $1,167.1 per ounce August 16, 2018 (December 2018 contract)
Silver $14.315 per ounce August 15, 2018 (September 2018 contract)
Copper $2.552 per pound ($5,626 per tonne) August 15, 2018 (September 2018 contract)
Comex copper is presently trading at $2.6475 per pound ($5,837 per tonne), now 20.5% below December's high. Improving global growth had kept the red metal above the key $3 per pound. Initial trade war fears dipped the red metal below this mark but copper then rebounded above $3. Current trade war tensions with China and deteriorating economic conditions there coupled with a strong U.S. dollar have sent the red metal plummeting. Copper price is in bear territory (i.e. down 20%).
Total copper stored in LME and Nymex warehouses is 0.451 million tonnes, slightly down from last week and still below the 0.5 million tonne mark.
LME inventories are declining after a run-up in August:

It is instructive to keep our eyes on the Nymex inventories which are behind the LME and falling (LME 262,100 versus Nymex 188,878 tonnes):

My Input to Kitco News
Target gold price $1,210 per ounce. Target silver price $14.30 per ounce.
The currencies of the world's largest consumers of gold and silver together with the ratio of gold-to-silver are key metrics to monitor for future direction.
I believe the most important news for precious metals this week is not today's stronger-than-expected labor report but the gold-to-silver ratio (GSR). Yesterday, one ounce of Comex gold bought 84.8 ounces of silver - a level higher than March 2016 and approaching a peak set during the financial crisis of 90.5 ounces per ounce (November 2008).
A GSR that exceeds the 80-level is often a sign that a reversal of fortunes is in the winds for precious metals. I checked this hypothesis with a gold/silver trader in Mumbai this week. He said that silver in $14 per ounce territory is a buy if the Modi government steps in to support the falling rupee (USD/INR). Like the Chinese yuan, the rupee has been in decline since April and gold has been tightly correlated with the former. The Chinese yuan appears to be stabilizing around 6.80-6.85 (USD/CNY) and gold is demonstrating resilience around $1,200 per ounce.
My updated currency model for gold, which includes the euro, Japanese yen and yuan, suggests a Comex range of $1,197 to $1,225 per ounce for a yuan approaching 6.85. I expect it likely that gold will tick up to $1,210 per ounce next week near mid-range. Embattled silver will initially creep ahead to $14.3 per ounce territory. My outlook for both is bullish, the lows are in for 2018.
[see Weekly Summary Chart]
Additional Note:
The fate of the Chinese yuan remains a key tell for gold and copper; a material drop in valuation could impact both negatively. Some suspect currency devaluation is being used as a tool in a U.S./China trade war. Something to watch: the yuan has been dramatically weakening since mid-April.
The yuan stabilized below 7 USD/CNY for 2017 and started stronger in the new year followed by a weakening trend. The yuan is now above the 6.8-level at 6.8441 USD/CNY putting a lot of daylight above the March 26th low (i.e. much stronger level) of 6.2342. A 1-month yuan volatility of 0.46% is in line with major currency levels and less than gold - something else to watch compared to 1-month volatilities of euro and yen*
* the euro & yen 1-month volatilites are 1.00% & 0.31% respectively; Comex gold 1-month volatility is an elevated 0.88%
Weekly Summary for September 7, 2018 AM
Weekly Summary for September 7, 2018 AM

(click on table for larger size)
Yearly Summary for 2017

(click on table for larger size)
Comex gold gained nearly 14% for the year but was outpaced by Comex copper that enjoyed a 32% uptick in price. Comex silver lagged both for a respectable 7.2% gain. Overall, gold gained 12% on the broader Bloomberg Commodity Index (BCOMTR:IND) which includes everything from crude oil to things that oink. In terms of major currencies, gold in terms of yen advanced almost 10% but slipped 0.4% relative to the strengthening euro.
Although gold slipped 5% in value relative to the S&P 500 it was not a bad year at all for the yellow metal!

Gold Price Revised Outlook for 2018:
My Comex gold range for 2017 was $1,250 to $1,400. We closed 2017 comfortably above $1,300 at $1,309.3 (February contract).
Let's assume 2018, like 2017, is a mix of buoyant market expectations and rising rates with occasional geopolitical, political and economic shocks. Gold will feel the headwinds of the former and enjoy price spikes in times of market stress. My latest revised range given the strong correlation with falling currencies compared to a strong U.S. dollar is a $1,150 floor with highs not exceeding $1,380 per ounce.
2018 will prove a less bullish period for gold than last year with higher interest rates in the U.S. Inflation will be another key factor to monitor, it has been on the rise but now may be moderating (see chart above in discussion).
The difference between interest rates and inflation expectations drives gold price; if the former leads the latter, there could be stiff headwinds for the lustrous metal. A trade war that results in slower growth and higher inflation could be potentially very bullish for gold.
Here's the beer bet for 2018: Gold will fall below $1,220 before rising above $1,380. We ended 2017 in the middle of that range with prices just above $1,300 - a fair starting point [Gold bet won Thursday July 19]
Important charts to watch remain the gold-to-S&P500 or AUSP (see "Chart to Watch" below) and gold in terms of major currencies euro and Japanese yen (directly below). An explanation of the charts below is given in this Kitco News column:
The Gartman Gold Trade Revisited (Kitco News, 2/14/2018)
Note fall in gold value for all three currencies:
Click on the image for a larger size:

Gold in euro & yen terms with good margin above 2013 lows
Divergence resumes for gold in terms of euro compared to yen:

Gold euro/yen spread widens again in 2018
Note for currency buffs: Value parity in the above chart occurs when the EUR/JPY cross rate is 139.24; something to watch for - presently 128.58 yen per euro as the gold euro/yen spread continues divergence.
Chart to Watch
Here's a chart to watch for 2018. Click on the image for a larger size:
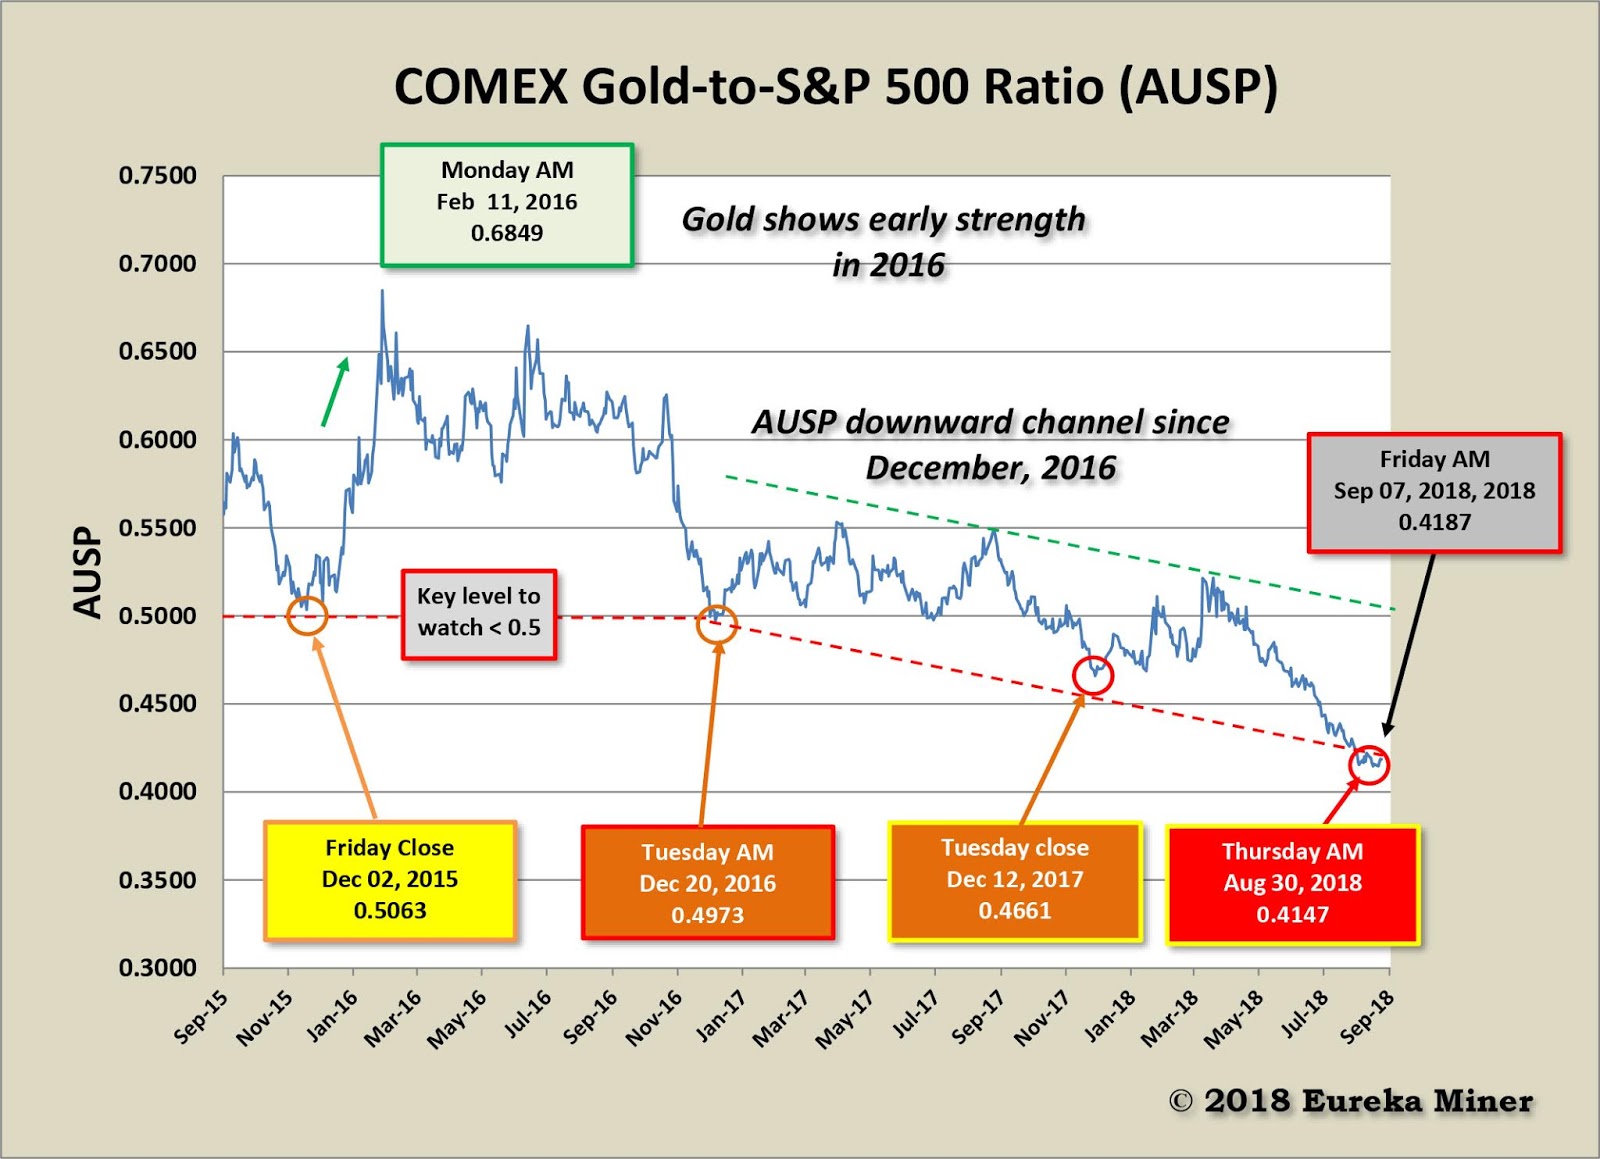
Gold-to-S&P 500 Ratio
An important gold ratio is gold-to-S&P500 or AUSP. The ratio bottomed in early-December of 2015 and reversed to a bullish trend, peaking February 11, 2016 (0.6849). It bottomed December 20, 2016 (0.4973) trended higher but then bearishly bottomed again December, 12, 2017 (0.4661) and again August 30, 2018 (0.4147). Currently this AM the AUSP is at 0.4187 trying to recover to the lower boundary of a downward trending channel (revised 8/10, green/red dotted lines).
Cheers,
Colonel Possum & Mariana


.png)


.jpg)


.jpg)
No comments:
Post a Comment