"The history of Eureka lies in its future." - Lambert Molinelli, 1878

DISCLOSURE

The author/editor of the Eureka Miner owns common shares of local mining stocks, McEwen Mining (MUX) and General Moly (GMO). Please do your own research, markets can turn on you faster than a feral cat.

Thursday, March 22, 2012

General Moly - A "No" to Good Neighbor; Lousy China PMI

Just down the road a piece...

Latest Nevada Fuel Prices (click this link)

NEW FORMAT for 2012

Morning Commentary
Daily Market Roundup
- Gold & Silver Report
- Copper & Molybdenum Report
- Oil Watch
- Debt Crisis Watch
- Stock Market Morning Update
- Eureka Miner's Million Dollar Grubstake Portfolio


My latest Kitco commentary: Copper Bids Adieu to Gold and Silver (3/19/2011)

My Latest International Business Times commentary: Silver to Gold, “Whither Thou Goest…” (02/27/2011)

This morning's...
COMEX Gold price = $1,635.5/oz (April contract most active)
Eureka Miner’s Gold Value Index© (GVI) = 87.77 (gold value trending down)
Value Adjusted Gold Price© (VAGP) = $1,583.2/oz
COMEX - VAGP = $78.6/oz; gold is trading at a declining premium to key commodities; the gold-to-copper ratio remains below its 3-month average and compressing (Cu bullish)


Þūnresdæg
Morning Miners!

It is 6:09 AM. Have a cup of Thor's Dragon Breath - it's a little cold, our favorite Norseman tripped on the power cord this morning as he went outside to chop firewood with his battle axe. It looks like the Chinese dragon is losing a little fire in its breath too...

General Moly - A "No" to Good Neighbor

Thanks to a vigilant reader of this report the following is actually old news. The Colonel posted this bulletin Tuesday:

BREAKING NEWS: Words from a trusted source and friend of the Report, "[Eureka]County Commissioners rejected General Moly’s $12M water settlement offer just moments ago." (e-mail received 10:15 AM PST, 3/20/2012)

Yesterday at 1:51 PM, General Moly posted a formal press release with the details of the rejection of their Good Neighbor offer:

$12 Million Offer to Augment Existing Sustainability Trust Rejected (Press Release, 3/21/20120)

Chief Executive officer Bruce D. Hansen says in the release,

We reached out and made this offer to Eureka County and its residents as a Good Neighbor, with the goal of working together, to enhance the sustainability and properly manage water resources in both the Kobeh Valley and Diamond Valley water basins. Unfortunately, we are disappointed with the Eureka County commissioners’ decision to continue down the path of unnecessary spending on legal action which further deprives the community of an opportunity to positively impact a decades’ old severe over-pumping situation in the Diamond Valley water basin, which has no relationship to the Mt. Hope project. We are moving forward aggressively. As we have stated when the Good Neighbor Offer was presented on March 6th, we remain extremely confident the State Engineer's Ruling will be upheld. At the same time we will always discuss reasonable and rational concepts to resolve this situation.

The next step is the April 3rd hearing and subsequent ruling of the Nevada District Court with Judge Papas. His ruling could take several months.

A disappointing development for General Moly (GMO) investors and supporters indeed. However, General Moly share price has not been punished as much as one might expect. Today GMO is down 4% at $3.29 but most of the miners are down too on a lousy economic indicator from China (below). Investors throwing in the towel would have resulted in a much steeper sell-off Tuesday, Wednesday or today.

Keep hope alive for Mt. Hope.

Lousy China PMI

A lousy Chinese manufacturing survey has thrown a wrench at the metals & miners this morning. The preliminary HSBC purchasing managers index for March was 48.1, down from a final reading of 49.6 for February. Dennis Gartman of the respected Gartman Letter often wisely reminds his readers that the actual number is not as important as the fact that the index is below 50 (indicating contraction, not expansion).

Philosophically, I believe we are witnessing a major re-pricing exercise going on between precious and base metals to the emerging new-new realities: better-than expected domestic recovery, a slower-than-expected China and a Europe that has stabilized but moves forward with serious challenges ahead. I'm still bullish on copper (i.e copper price slowly transitioning from Price Domain B to Price Domain A) once the dust settles for reasons I'll elaborate on in tomorrow's gold, silver and copper report.

Keep the faith, pardner.

Daily Market Roundup


Mining Report

This morning's mining stocks...

Barrick (ABX) $43.17 down 1.05%
Newmont (NEM) $52.65 down 0.98%
McEwen Mining (MUX) 3.79 down 2.82% (formerly US Gold, UXG)
General Moly (Eureka Moly, LLC) (GMO) $3.29 down 4.08%
Thompson Creek (TC) $6.85 down 1.86%
Freeport-McMoRan (FCX) $38.72 down 2.71% (a bellwether mining stock spanning copper, gold & molybdenum)
Quadra FNX (TSE:QUX) $n/a
Timberline Resources (TLR) $0.50 down 1.96%

The Steels  (a "tell" for General Moly & Thompson Creek):

ArcelorMittal (MT) $19.70 down 3.43% - global steel producer
POSCO (PKX) $84.32 down 2.20% - South Korean integrated steel producer

The Eureka Miner's Index© (EMI) was re-calibrated 2/8 to reflect current 200-day moving averages for benchmark miners.

The EMI is above-par at 170.24, down from last report's 201.39 and below the 1-month moving average of 201.39. The 1-month average is falling but still above the key 100-level.

The EMI gives us the market temperature for the factors that have the greatest impact on mining in Eureka County. The record 2010-2012 high for the EMI is 816.78 set 01/04/2011; the low was set 10/4/2011 at 22.88. An EMI of 100 is the boundary between hot and cold markets for the metals & miners.

Gold & Silver Report

This morning's...

COMEX gold is down $14.8/oz at $1,635.5/oz (April contract, most active)

COMEX silver is down $0.607/oz at $31.620/oz (May contract, most active)

The gold-to-silver ratio (Au:Ag) is 51.724 oz/oz

Silver 1-month CRS© is 1.70% (bullish level); CRS© stalled convergence (Ag neutral)

The Eureka Miner’s Gold Value Index© (GVI) is below-par at 87.77, up from last report's 87.32 and below its 1-month average of 88.72. Gold value is now trending down. The record high for 2010-2012 is 109.97 set on Oct. 4, 2011.

The Value Adjusted Gold Price© (VAGP) is $1,556.9/oz which is only $78.6/oz below the current COMEX gold price.

The GVI gauges the value of gold in relation to oil, copper and silver independent of currency. These three commodities were chosen for relative value comparison because 1) oil derivatives are a common cost element for all miners, 2) copper has proven to be a reliable proxy for global growth and 3) silver is a precious and industrial metal that now competes with gold for investment and as a hedge against fiat currencies.

The Value Adjusted Gold Price (VAGP) is a level that supports current oil, copper & oil prices based on historical commodity norms. If the daily COMEX price is less than the VAGP, then gold is undervalued; if above, overvalued.

Copper & Molybdenum Report

This morning's...

COMEX copper is down $0.0800/lb at $3.7655/lb (May contract, most active)

The gold-to-copper ratio is 434.34 lb/oz; ratios in excess of 400 lb/oz are considered "recession levels"; the ratio is below its 3-month moving average of 449.71 (Cu bullish trend emerging in Price Domain B)

Copper 1-month CRS© is 2.89% (bullish level); convergence, compressing ratio (Cu bullish)

The latest molybdenum oxide spot and futures prices (courtesy of Thompson Creek Metals):

Metals Week Average:
US$14.125
As of March 19, 2012
(updated weekly)

Ryan's Notes Average:
US$14.10
As of March 20, 2012
(updated twice weekly)

European Molybdenum Oxide (Bloomberg average price, updated Wednesday & Friday):
US$14.05/lb

London metal Exchange (LME) molybdenum 3-month seller's contract:

US$14.52/lb (US$32,000/metric ton)

Daily Oil Watch

Latest Nevada Fuel Prices (click this link)

On February 1st, 2011, we identified North Sea Brent crude oil as a good barometer for the crises in the Middle East and North Africa (MENA). The next conflict could be in the Persian Gulf. Brent remains above $120/bbl maintaining a spread above the North American benchmark, Western Texas Intermediate or "Texas light sweet crude", traded on the NYMEX.

Here are the key front-month contracts this morning:

NYMEX light sweet crude $105.48
ICE North Sea Brent crude $123.32
Spread (ICE- NYMEX) = $17.84 (last report, $17.69)

Here are the July contracts* with a narrower spread:

NYMEX light sweet crude $106.48
ICE North Sea Brent crude $122.21
Spread (ICE- NYMEX) = $15.73 (last report, $15.84)

* NYMEX futures contracts have rolled forward, we now show May and July for a 2-month look-ahead

NYMEX WTI 1-month CRS© is 2.53% (bullish level); CRS© divergent (Oil bearish)

Prices are near highs for 2012, we have $120+ Brent and $105+ NYMEX in July favoring high oil prices this spring into summer. A front-month spread between Brent and WTI >$20/bbl is a trouble sign, OK for now.

Daily Debt Crisis Watch

July 26th we introduced the Debt Crisis Index (DCI). The DCI is computed in the mornings and at the market close Friday in much the same way we do the EMI and GVI indices. Today, the DCI is 76.3 up from last report's 70.8. A level above 200 is time for serious concern - we are now well below that level. The highest level recorded since inception was 271.0 Aug. 9, 2011; the lowest level is 65.1 on Mar. 13, 2012

Global sovereign debt issues have been an overhang on markets for many, many months starting with the Dubai crisis in late November, 2009 and spreading to the euro-zone in 2010-2011 and continuing into 2012.

Stock Market Morning Update

The DOW is down 45.97 to 13,078.65; the S&P 500 is down 6.87 points at 1,396.02

The Eureka Miner's Grubstake Portfolio is down 1.99% at $1,411,381.57 (what's this?).

Cheers,

Colonel Possum

Headline photograph by Mariana Titus

Write Colonel Possum at colonelpossum@gmail.com for answers to your questions or to request e-mail updates on the market

Wednesday, March 21, 2012

Gold, Copper & Shanghai Composite

Isn't it good, Norwegian wood? Devil's Gate, Eureka Nevada

Latest Nevada Fuel Prices (click this link)

NEW FORMAT for 2012

Morning Commentary
Daily Market Roundup
- Gold & Silver Report
- Copper & Molybdenum Report
- Oil Watch
- Debt Crisis Watch
- Stock Market Morning Update
- Eureka Miner's Million Dollar Grubstake Portfolio


My latest Kitco commentary: Copper Bids Adieu to Gold and Silver (3/19/2011)

My Latest International Business Times commentary: Silver to Gold, “Whither Thou Goest…” (02/27/2011)

This morning's...
COMEX Gold price = $1,654.4/oz (April contract most active)
Eureka Miner’s Gold Value Index© (GVI) = 87.32 (gold value trending down)
Value Adjusted Gold Price© (VAGP) = $1,583.2/oz
COMEX - VAGP = $71.2/oz; gold is trading at a declining premium to key commodities; the gold-to-copper ratio remains below its 3-month average and compressing (Cu bullish)


Wōdnesdæg
Morning Miners!

It is 5:51 AM. Have a cup of Wōdnesdæg Lonesome. Yeah, that's how it feels in the break room - Old Miner Woden won't come out of his cave today. Fed Chairman Ben Bernanke is due to speak today and it seems lately every time he does gold drops another $50. Woden calls them "Bernanke Days" and calls in sick. The ole cuss just can't wait for the world to end and gold to go to $10,000 per ounce!

Gold, Copper & Shanghai Composite

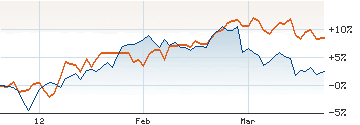
Here are two 3-month charts to get you thinking; COMEX gold and copper versus the Shanghai Composite Index (orange). First, COMEX gold (blue) versus the Shanghai:


And then, COMEX copper (blue) versus the Shanghai:


As Europe recedes as a major worry (at least for now), China's 2012 growth prospects have become the topic du jour for metals & miners lately. I find it interesting that gold and the Shanghai composite roughly tracked each other up until late-February and now are descending together but gold at a quicker pace - in 3-months, gold is up 3.5% to Shanghai's 9%.

By contrast, copper has been showing price good strength in March compared to either gold or the Chinese market index - in 3-months, copper is up 13% to Shanghai's 9% and gold's 3.5%. With all the fretting about metals and China, better prospects in the U.S. and supply tightness seem to be keeping the red metal fairly buoyant. Just something to ponder on your break - have a good'un.

Daily Market Roundup


Mining Report

This morning's mining stocks...

Barrick (ABX) $43.97 up 0.41%
Newmont (NEM) $53.80 up 0.22%
McEwen Mining (MUX) 4.18 up 2.70% (formerly US Gold, UXG)
General Moly (Eureka Moly, LLC) (GMO) $3.46 up 0.87%
Thompson Creek (TC) $6.97 up 0.29%
Freeport-McMoRan (FCX) $39.44 up 0.74% (a bellwether mining stock spanning copper, gold & molybdenum)
Quadra FNX (TSE:QUX) $n/a
Timberline Resources (TLR) $0.49 unchanged

The Steels  (a "tell" for General Moly & Thompson Creek):

ArcelorMittal (MT) $20.47 down 0.97% - global steel producer
POSCO (PKX) $86.59 down 1.97% - South Korean integrated steel producer

The Eureka Miner's Index© (EMI) was re-calibrated 2/8 to reflect current 200-day moving averages for benchmark miners.

The EMI is above-par at 199.30, up from last report's 199.30 and below the 1-month moving average of 204.30. The 1-month average is falling but still above the key 100-level.

The EMI gives us the market temperature for the factors that have the greatest impact on mining in Eureka County. The record 2010-2012 high for the EMI is 816.78 set 01/04/2011; the low was set 10/4/2011 at 22.88. An EMI of 100 is the boundary between hot and cold markets for the metals & miners.

Gold & Silver Report

This morning's...

COMEX gold is up $7.4/oz at $1,654.4/oz (April contract, most active)

COMEX silver is up $0.311/oz at $32.145/oz (May contract, most active)

The gold-to-silver ratio (Au:Ag) is 51.467 oz/oz

Silver 1-month CRS© is 1.70% (bullish level); CRS© weak convergence (Ag neutral)

The Eureka Miner’s Gold Value Index© (GVI) is below-par at 87.32, up from last report's 87.07 and below its 1-month average of 88.92. Gold value is now trending down. The record high for 2010-2012 is 109.97 set on Oct. 4, 2011.

The Value Adjusted Gold Price© (VAGP) is $1,583.2/oz which is only $71.2/oz below the current COMEX gold price.

The GVI gauges the value of gold in relation to oil, copper and silver independent of currency. These three commodities were chosen for relative value comparison because 1) oil derivatives are a common cost element for all miners, 2) copper has proven to be a reliable proxy for global growth and 3) silver is a precious and industrial metal that now competes with gold for investment and as a hedge against fiat currencies.

The Value Adjusted Gold Price (VAGP) is a level that supports current oil, copper & oil prices based on historical commodity norms. If the daily COMEX price is less than the VAGP, then gold is undervalued; if above, overvalued.

Copper & Molybdenum Report

This morning's...

COMEX copper is up $0.0225/lb at $3.8530/lb (May contract, most active)

The gold-to-copper ratio is 429.38 lb/oz; ratios in excess of 400 lb/oz are considered "recession levels"; the ratio is below its 3-month moving average of 450.41 (Cu bullish trend emerging in Price Domain B)

Copper 1-month CRS© is 2.97% (bullish level); convergence, compressing ratio (Cu bullish)

The latest molybdenum oxide spot and futures prices (courtesy of Thompson Creek Metals):

Metals Week Average:
US$14.125
As of March 19, 2012
(updated weekly)

Ryan's Notes Average:
US$14.10
As of March 16, 2012
(updated twice weekly)

European Molybdenum Oxide (Bloomberg average price, updated Wednesday & Friday):
US$14.05/lb

London metal Exchange (LME) molybdenum 3-month seller's contract:

US$14.52/lb (US$32,000/metric ton)

Daily Oil Watch

Latest Nevada Fuel Prices (click this link)

On February 1st, 2011, we identified North Sea Brent crude oil as a good barometer for the crises in the Middle East and North Africa (MENA). The next conflict could be in the Persian Gulf. Brent remains above $120/bbl maintaining a spread above the North American benchmark, Western Texas Intermediate or "Texas light sweet crude", traded on the NYMEX.

Here are the key front-month contracts this morning:

NYMEX light sweet crude $106.51
ICE North Sea Brent crude $124.20
Spread (ICE- NYMEX) = $17.69 (last report, $17.31)

Here are the July contracts* with a narrower spread:

NYMEX light sweet crude $107.46
ICE North Sea Brent crude $123.30
Spread (ICE- NYMEX) = $15.84 (last report, $15.99)

* NYMEX futures contracts have rolled forward, we now show May and July for a 2-month look-ahead

NYMEX WTI 1-month CRS© is 2.64% (bullish level); CRS© divergent (Oil bearish)

Prices are near highs for 2012, we have $120+ Brent and $105+ NYMEX in July favoring high oil prices this spring into summer. A front-month spread between Brent and WTI >$20/bbl is a trouble sign, OK for now.

Daily Debt Crisis Watch

July 26th we introduced the Debt Crisis Index (DCI). The DCI is computed in the mornings and at the market close Friday in much the same way we do the EMI and GVI indices. Today, the DCI is 70.8 down from last report's 76.4. A level above 200 is time for serious concern - we are now well below that level. The highest level recorded since inception was 271.0 Aug. 9, 2011; the lowest level is 65.1 on Mar. 13, 2012

Global sovereign debt issues have been an overhang on markets for many, many months starting with the Dubai crisis in late November, 2009 and spreading to the euro-zone in 2010-2011 and continuing into 2012.

Stock Market Morning Update

The DOW is up 10.82 to 13,181.01; the S&P 500 is up 1.43 points at 1,406.95

The Eureka Miner's Grubstake Portfolio is down 0.39% at $1,456,198.46 (what's this?).

Cheers,

Colonel Possum

Headline photograph by Mariana Titus

Write Colonel Possum at colonelpossum@gmail.com for answers to your questions or to request e-mail updates on the market

Tuesday, March 20, 2012

BHP Warning on China; American Vanadium Pledge

Alaskite, Devil's Gate, Eureka, Nevada

BREAKING NEWS: Words from a trusted source and friend of the Report, "[Eureka]County Commissioners rejected General Moly’s $12M water settlement offer just moments ago." (e-mail received 10:15 AM PST)

Latest Nevada Fuel Prices (click this link)

NEW FORMAT for 2012

Morning Commentary
Daily Market Roundup
- Gold & Silver Report
- Copper & Molybdenum Report
- Oil Watch
- Debt Crisis Watch
- Stock Market Morning Update
- Eureka Miner's Million Dollar Grubstake Portfolio


My latest Kitco commentary: Copper Bids Adieu to Gold and Silver (3/19/2011)

My Latest International Business Times commentary: Silver to Gold, “Whither Thou Goest…” (02/27/2011)

This morning's...
COMEX Gold price = $1,582.9/oz (April contract most active)
Eureka Miner’s Gold Value Index© (GVI) = 87.07 (gold value trending down)
Value Adjusted Gold Price© (VAGP) = $1,582.9/oz
COMEX - VAGP = $66.6/oz; gold is trading at a declining premium to key commodities; the gold-to-copper ratio remains below its 3-month average and compressing (Cu bullish)


Morning Miners!

It is 6:19 AM. Scott Raine delivered some of his famous Green Label Spring Java to the break room last night - let me pour you a cup of fresh brew. Ruby T has a big circle on March 20 on our Raine's Market calendar to remind us this is the first day of spring - have a good'un.

BHP Warning on China

Metals & Miners will unfortunately not have a great spring day after the world's largest miner BHP Billiton raised concerns about the possibility of a sharp slowdown in metals demand from China. London Reuters carries the story this morning:

METALS-Copper falls on China demand concerns, dollar strength (By Susan Thomas, London Reuters, Tue Mar 20, 2012 12:20pm GMT)

BNP Paribas analyst Stephen Briggs is quoted as saying, "There is a slowing trend in China ... moving increasingly away from the growth model that they have had, which may be a little less metals intensive. This is not new, but recognition by big mining companies would have had an effect."

As always, it is a matter of degree and that will remain hard to quantify for the time being. LME copper stocks are falling in London but rising in Shanghai warehouses. Yesterday, the report said the mining sector needed a catalyst to move it from its recent sideways performance. This may be the beginning as the Eureka Miner's Index© (EMI) dropped from 6-market days of low-200s to 172.11 this morning, just above the lower trend line (see report below). Assertively breaking this trend in the next several days would indeed be bearish for both metals and miners. Our market bull Ruby T just told me to quit my whining, I think I'll join her for some more Green Label!

American Vanadium Pledge

A faithful reader brought the following to my attention for those of us tracking the old Gibellini vanadium properties...

American Vanadium - the United State's only developer of critical mineral derivative, vandium pentoxide - plans to make batteries here, not China. American Vanadium is presently working the Gibellini Project in south-east corner of Eureka County. Here's the report from Industrial Metals:

AMERICAN VANADIUM FEATURED IN INDUSTRIAL MINERALS AND LAS VEGAS TRIBUNE (Industrial Metals - March 5, 2012)

The company's president and CEO Bill Radak explained to Industrial Minerals,"We are not going to be shipping tank-loads of vanadium to China...We aim to make the batteries here in he U.S."

The best of luck to these guys!

Daily Market Roundup


Mining Report

This morning's mining stocks...

Barrick (ABX) $42.64 down 2.29%
Newmont (NEM) $52.75 down 1.46%
McEwen Mining (MUX) 3.96 down 3.65% (formerly US Gold, UXG)
General Moly (Eureka Moly, LLC) (GMO) $3.35 down 2.62%
Thompson Creek (TC) $6.87 down 3.10%
Freeport-McMoRan (FCX) $37.98 down 2.96% (a bellwether mining stock spanning copper, gold & molybdenum)
Quadra FNX (TSE:QUX) $n/a
Timberline Resources (TLR) $0.49 down 2.00%

The Steels  (a "tell" for General Moly & Thompson Creek):

ArcelorMittal (MT) $20.48 down 4.16% - global steel producer
POSCO (PKX) $86.97 down 3.26% - South Korean integrated steel producer

The Eureka Miner's Index© (EMI) was re-calibrated 2/8 to reflect current 200-day moving averages for benchmark miners.

The EMI is above-par at 172.11, down from last report's 201.21 and below the 1-month moving average of 206.00. The 1-month average is falling but still above the key 100-level.

The EMI gives us the market temperature for the factors that have the greatest impact on mining in Eureka County. The record 2010-2012 high for the EMI is 816.78 set 01/04/2011; the low was set 10/4/2011 at 22.88. An EMI of 100 is the boundary between hot and cold markets for the metals & miners.

Gold & Silver Report

This morning's...

COMEX gold is down $17.8/oz at $1,649.5/oz (April contract, most active)

COMEX silver is down $0.645/oz at $32.310/oz (May contract, most active)

The gold-to-silver ratio (Au:Ag) is 51.052 oz/oz

Silver 1-month CRS© is 1.76% (bullish level); CRS© weak convergence (Ag neutral)

The Eureka Miner’s Gold Value Index© (GVI) is below-par at 87.07, up from last report's 86.38 and below its 1-month average of 89.17. Gold value is now trending down. The record high for 2010-2012 is 109.97 set on Oct. 4, 2011.

The Value Adjusted Gold Price© (VAGP) is $1,582.9/oz which is only $66.6/oz below the current COMEX gold price.

The GVI gauges the value of gold in relation to oil, copper and silver independent of currency. These three commodities were chosen for relative value comparison because 1) oil derivatives are a common cost element for all miners, 2) copper has proven to be a reliable proxy for global growth and 3) silver is a precious and industrial metal that now competes with gold for investment and as a hedge against fiat currencies.

The Value Adjusted Gold Price (VAGP) is a level that supports current oil, copper & oil prices based on historical commodity norms. If the daily COMEX price is less than the VAGP, then gold is undervalued; if above, overvalued.

Copper & Molybdenum Report

This morning's...

COMEX copper is down $0.0805/lb at $3.8285/lb (May contract, most active)

The gold-to-copper ratio is 430.85 lb/oz; ratios in excess of 400 lb/oz are considered "recession levels"; the ratio is below its 3-month moving average of 451.22 (Cu bullish trend emerging in Price Domain B)

Copper 1-month CRS© is 3.07% (bullish level); divergence stalling (Cu neutral)

The latest molybdenum oxide spot and futures prices (courtesy of Thompson Creek Metals):

Metals Week Average:
US$14.125
As of March 19, 2012
(updated weekly)

Ryan's Notes Average:
US$14.10
As of March 16, 2012
(updated twice weekly)

European Molybdenum Oxide (Bloomberg average price, updated Wednesday & Friday):
US$14.05/lb

London metal Exchange (LME) molybdenum 3-month seller's contract:

US$14.52/lb (US$32,000/metric ton)

Daily Oil Watch

Latest Nevada Fuel Prices (click this link)

On February 1st, 2011, we identified North Sea Brent crude oil as a good barometer for the crises in the Middle East and North Africa (MENA). The next conflict could be in the Persian Gulf. Brent remains above $120/bbl maintaining a spread above the North American benchmark, Western Texas Intermediate or "Texas light sweet crude", traded on the NYMEX.

Here are the key front-month contracts this morning:

NYMEX light sweet crude $106.85
ICE North Sea Brent crude $124.16
Spread (ICE- NYMEX) = $17.31 (last report, $18.03)

Here are the June contracts* with a narrower spread:

NYMEX light sweet crude $107.77
ICE North Sea Brent crude $123.76
Spread (ICE- NYMEX) = $15.99 (last report, $16.57)

* NYMEX futures contracts have rolled forward, we now show April and June for a 2-month look-ahead

NYMEX WTI 1-month CRS© is 2.76% (bullish level); CRS© divergent (Oil bearish)

Prices are near highs for 2012, we have $120+ Brent and $105+ NYMEX in June favoring high oil prices this spring into summer. A front-month spread between Brent and WTI >$20/bbl is a trouble sign, OK for now but getting closer.

Daily Debt Crisis Watch

July 26th we introduced the Debt Crisis Index (DCI). The DCI is computed in the mornings and at the market close Friday in much the same way we do the EMI and GVI indices. Today, the DCI is 76.4 up from last report's 70.5. A level above 200 is time for serious concern - we are now well below that level. The highest level recorded since inception was 271.0 Aug. 9, 2011; the lowest level is 65.1 on Mar. 13, 2012

Global sovereign debt issues have been an overhang on markets for many, many months starting with the Dubai crisis in late November, 2009 and spreading to the euro-zone in 2010-2011 and continuing into 2012.

Stock Market Morning Update

The DOW is down 91.95 to 13,147.18; the S&P 500 is down 9.08 points at 1,400.67

The Eureka Miner's Grubstake Portfolio is down 2.25% at $1,435,286.83 (what's this?).

Cheers,

Colonel Possum

Headline photograph by Mariana Titus

Write Colonel Possum at colonelpossum@gmail.com for answers to your questions or to request e-mail updates on the market

Monday, March 19, 2012

Miners 2012 - "Mark time, MARCH"

Day at the Beach - 350,000,000 B.C. Devil's Gate, Eureka, Nevada

Latest Nevada Fuel Prices (click this link)

NEW FORMAT for 2012

Morning Commentary
Daily Market Roundup
- Gold & Silver Report
- Copper & Molybdenum Report
- Oil Watch
- Debt Crisis Watch
- Stock Market Morning Update
- Eureka Miner's Million Dollar Grubstake Portfolio


My latest Kitco commentary: Copper Bids Adieu to Gold and Silver (3/19/2011)

My Latest International Business Times commentary: Silver to Gold, “Whither Thou Goest…” (02/27/2011)

This morning's...
COMEX Gold price = $1,655.5/oz (April contract most active)
Eureka Miner’s Gold Value Index© (GVI) = 86.10 (gold value trending down)
Value Adjusted Gold Price© (VAGP) = $1,601.3/oz
COMEX - VAGP = $54.2/oz; gold is trading at a declining premium to key commodities; the gold-to-copper ratio remains below its 3-month average and compressing (Cu bullish)


Morning Miners!

It is 6:01 AM. Have a hot cup of Monday Morning and then let's do a little close order drill to warm up - hup, hup, hup...two, three, four


Miners 2012 - "Mark time, MARCH"

If you have never enjoyed the delight of marching to drill commands, "Mark time, MARCH" is the command to march in place and go nowhere. That's what the miners have done for the last 6-market days, at least according to this report's Eureka Miner's Index© (EMI). The EMI gives us the market temperature for the factors that have the greatest impact on mining in Eureka County. These include the share price of the three benchmark miners that we've been examining in the Miners 2012 Series, interest rates, market volatility and oil, copper, gold and silver prices. Individually each factor has moved about quite a bit in the last week but the composite index has averaged 201.61 with less than an 8 point change in either direction; today the EMI is 201.21. Truly amazing.

Typically in markets when things move sideways for an extended period the likelihood of a dramatic move up (or down) is increased. The expression is "the longer the base, the higher the space." The EMI is faithfully forming a base around 200, comfortably above our key-level of 100 which is the dividing line between cold and hot markets. As, the EMI departs from this base there will be more "space" to move higher (or lower). Why such things are so is "beyond our ken to know" as Dennis Gartman of the well respected Gartman Letter often says.

Here is the latest EMI chart from December, 2010 to last Friday's close (a larger and more readable plot can be found at the bottom of this blog page):


The EMI (magenata) is just below its 1-month moving average (blue). Breaking above the average would be bullish for the mining sector going forward; breaking it dramatically would be very bullish. On the other hand, if the EMI drops it will soon challenge the lower trend (dotted line) which would be a bearish move; breaking to the downside with drama would be very bearish. For the time being it is "Mark time, MARCH."

Stay tuned, pardner. Theory says we're approaching something a lot more exciting to watch than close order drill.

Copper Bids Adieu to Gold and Silver

Kitco news just posted my latest commentary on our favorite metals:

Copper Bids Adieu to Gold and Silver (Kitco News, 3/19/2011)

This is the sequel to Silver & Copper 2012 - A Tale of Two Metals. Our favorite metals again find themselves in 18th century France at the mercy of a vengeful Madame...

Daily Market Roundup


Mining Report

This morning's mining stocks...

Barrick (ABX) $44.03 up 0.18%
Newmont (NEM) $53.95 up 0.37%
McEwen Mining (MUX) 4.16 up 3.23% (formerly US Gold, UXG)
General Moly (Eureka Moly, LLC) (GMO) $3.35 up 2.13%
Thompson Creek (TC) $7.09 up 1.29%
Freeport-McMoRan (FCX) $39.60 up 2.70% (a bellwether mining stock spanning copper, gold & molybdenum)
Quadra FNX (TSE:QUX) $n/a
Timberline Resources (TLR) $0.51 up 2.00%

The Steels  (a "tell" for General Moly & Thompson Creek):

ArcelorMittal (MT) $20.97 up 1.01% - global steel producer
POSCO (PKX) $89.57 up 0.83% - South Korean integrated steel producer

The Eureka Miner's Index© (EMI) was re-calibrated 2/8 to reflect current 200-day moving averages for benchmark miners.

The EMI is above-par at 201.21, up from last report's 200.54 and below the 1-month moving average of 206.80. The 1-month average is falling but still above the key 100-level.

The EMI gives us the market temperature for the factors that have the greatest impact on mining in Eureka County. The record 2010-2012 high for the EMI is 816.78 set 01/04/2011; the low was set 10/4/2011 at 22.88. An EMI of 100 is the boundary between hot and cold markets for the metals & miners.

Gold & Silver Report

This morning's...

COMEX gold is down $0.3/oz at $1,655.5/oz (April contract, most active)

COMEX silver is down $0.114/oz at $32.490/oz (May contract, most active)

The gold-to-silver ratio (Au:Ag) is 50.940 oz/oz

Silver 1-month CRS© is 1.89% (bullish level); CRS© weak divergence (Ag neutral)

The Eureka Miner’s Gold Value Index© (GVI) is below-par at 86.38, down from last report's 86.70 and below its 1-month average of 89.42. Gold value is now solidly trending down. The record high for 2010-2012 is 109.97 set on Oct. 4, 2011.

The Value Adjusted Gold Price© (VAGP) is $1,601.3/oz which is only $54.2/oz below the current COMEX gold price.

The GVI gauges the value of gold in relation to oil, copper and silver independent of currency. These three commodities were chosen for relative value comparison because 1) oil derivatives are a common cost element for all miners, 2) copper has proven to be a reliable proxy for global growth and 3) silver is a precious and industrial metal that now competes with gold for investment and as a hedge against fiat currencies.

The Value Adjusted Gold Price (VAGP) is a level that supports current oil, copper & oil prices based on historical commodity norms. If the daily COMEX price is less than the VAGP, then gold is undervalued; if above, overvalued.

Copper & Molybdenum Report

This morning's...

COMEX copper is up $0.0165/lb at $3.8945/lb (May contract, most active)

The gold-to-copper ratio is 425.09 lb/oz; ratios in excess of 400 lb/oz are considered "recession levels"; the ratio is below its 3-month moving average of 452.05 (Cu bullish trend emerging in Price Domain B)

Copper 1-month CRS© is 3.03% (bullish level); divergent, compressing ratio(Cu bullish)

The latest molybdenum oxide spot and futures prices (courtesy of Thompson Creek Metals):

Metals Week Average:
US$14.125
As of March 19, 2012
(updated weekly)

Ryan's Notes Average:
US$14.10
As of March 16, 2012
(updated twice weekly)

European Molybdenum Oxide (Bloomberg average price, updated Wednesday & Friday):
US$14.05/lb

London metal Exchange (LME) molybdenum 3-month seller's contract:

US$14.52/lb (US$32,000/metric ton)

Daily Oil Watch

Latest Nevada Fuel Prices (click this link)

On February 1st, 2011, we identified North Sea Brent crude oil as a good barometer for the crises in the Middle East and North Africa (MENA). The next conflict could be in the Persian Gulf. Brent remains above $120/bbl maintaining a spread above the North American benchmark, Western Texas Intermediate or "Texas light sweet crude", traded on the NYMEX.

Here are the key front-month contracts this morning:

NYMEX light sweet crude $107.87
ICE North Sea Brent crude $125.90
Spread (ICE- NYMEX) = $18.03 (last report, $18.10)

Here are the June contracts* with a narrower spread:

NYMEX light sweet crude $108.81
ICE North Sea Brent crude $125.38
Spread (ICE- NYMEX) = $16.57 (last report, $16.03)

* NYMEX futures contracts have rolled forward, we now show April and June for a 2-month look-ahead

NYMEX WTI 1-month CRS© is 2.76% (bullish level); CRS© divergent (Oil bearish)

Prices are near highs for 2012, we have $120+ Brent and $105+ NYMEX in June favoring high oil prices this spring into summer. A front-month spread between Brent and WTI >$20/bbl is a trouble sign, OK for now but getting closer.

Daily Debt Crisis Watch

July 26th we introduced the Debt Crisis Index (DCI). The DCI is computed in the mornings and at the market close Friday in much the same way we do the EMI and GVI indices. Today, the DCI is 68.13 down from last report's 68.7. A level above 200 is time for serious concern - we are now well below that level. The highest level recorded since inception was 271.0 Aug. 9, 2011; the lowest level is 65.1 on Mar. 13, 2012

Global sovereign debt issues have been an overhang on markets for many, many months starting with the Dubai crisis in late November, 2009 and spreading to the euro-zone in 2010-2011 and continuing into 2012.

Stock Market Morning Update

The DOW is down 6.66 to 13,225.96; the S&P 500 is up 1.45 points at 1,405.62

The Eureka Miner's Grubstake Portfolio is up 0.85% at $1,464,371.03 (what's this?).

Cheers,

Colonel Possum

Headline photograph by Mariana Titus

Write Colonel Possum at colonelpossum@gmail.com for answers to your questions or to request e-mail updates on the market
Friday, March 16, 2012

The Colonel's Friday Thoughts on Gold, Silver & Copper

The Devil's in the Details, Devil's Gate, Eureka, Nevada

Latest Nevada Fuel Prices (click this link)

NEW FORMAT for 2012

Morning Commentary
Daily Market Roundup
- Gold & Silver Report
- Copper & Molybdenum Report
- Oil Watch
- Debt Crisis Watch
- Stock Market Morning Update
- Eureka Miner's Million Dollar Grubstake Portfolio


My latest Kitco commentary: Silver & Copper 2012 - A Tale of Two Metals (03/05/2012)

My Latest International Business Times commentary: Silver to Gold, “Whither Thou Goest…” (02/27/2011)

This morning's...
COMEX Gold price = $1,643.6/oz (April contract most active)
Eureka Miner’s Gold Value Index© (GVI) = 86.10 (gold value trending down)
Value Adjusted Gold Price© (VAGP) = $1,595.1/oz
COMEX - VAGP = $48.5/oz; gold is trading at a declining premium to key commodities; the gold-to-copper ratio remains below its 3-month average and compressing (Cu bullish)


Morning Miners!

It is 6:16 AM. Let me pour you a delicious cup of Raine's traditional Red Label TGIF brew. Have a great weekend and remember St.Patrick's Day is tomorrow. I'm Welsh-Irish-Norwegian...so THREE CHEERS!

The Colonel's Friday Thoughts on Gold, Silver & Copper

It is the poorest taste to brag on predictions in this curious business. Please forgive me this one time because I am part Irish and it is nearly St. Paddy's - the ole Colonel got three out of four right within 1% this week (although this may have more to do with uncommon ratio stability than Irish luck):

“The effects of the dramatic Feb. 29 sell-off of gold and silver still cast a shadow on both metals and the yellow could return to mid-$1,650 per ounce territory by next week” (3/09/2012)

“For $1,650/oz gold we can expect to see oil (WTI) in a range of $99-$104/bbl; silver, $32-$33/oz; and copper, $3.7-$3.9/lb.” (3/09/2012)

Predictions within 1%?

NYMEX/COMEX 9:23 AM ET, Today...

$1,643.6/oz given $1,650.0/oz => Yes, estimate high by 0.4%

$105.86 given $99-$104 => No, top-end estimate low by 1.8% > 1%

$32.395 given $32-$33 => Yes

$3.9290 given $3.7-$3.9 => Yes, top-end estimate low by 0.7%

Here is my morning's input to the Weekly Kitco Gold Survey:

Q. Where do you see gold’s price headed next week, up, down or unchanged?

A. Down, $1,640 per ounce target assuming no further deterioration of Persian Gulf tensions. My 2012 price floor of $1,615 per ounce remains unchanged.

Q.Why?

A. Gold prices continue to struggle as three broader markets make new highs above key psychological levels. Although real negative rates and the possibility of escalating tensions in the Persian Gulf remain bullish for gold, the list of downward pressures grows. This morning’s announcement that India may impose an import duty on gold joins diminished prospects for further U.S. quantitative easing, a stabilizing Europe and a stronger the U.S. dollar as more reasons for the yellow metal to lose some luster. Falling gold and rising copper prices are a bullish sign for the red metal which continues to show resilience compared to precious metals. A key metric to watch is the gold-to-copper ratio; compression below the 400 pound per ounce level would be notably bullish for the red metal. Silver’s high correlation and volatility relative to gold do not bode well for the white metal although the gold-to-silver ratio is stable and near historic norms. Industrial demand for silver also gives the white metal additional price support.

For $1,640/oz gold we can expect to see oil (WTI) in a range of $102-$106/bbl; silver, $31-$33/oz; and copper, $3.8-$4.0/lb.

Please also checkout:

METALS OUTLOOK: Currency Markets Likely To Influence Gold Next Week (By Debbie Carlson Of Kitco News, 16 March 2012, 2:24 p.m.)

Background Notes:

1. My Gold Value Index© (GVI) equals 86.10 this morning down 21.7% from the Oct. 4 high of 109.97, and at levels of early August, 2011.
2. The GVI continues to trend lower which is bullish for key commodities.
3. The gold-to-copper ratio today is 418.1 pounds per ounce and below its 3-month moving average of 452.8 pounds per ounce. Remaining below this average is bullish for copper going forward. 3-month relative volatility is 1.4X gold; 1-month is 0.65X gold
4. The gold-to-silver ratio is near historic norms at 50.7; 3-month rolling correlation is +0.942, relative volatility is 2.03X gold and price sensitivity (beta) is 1.911

Daily Market Roundup


Mining Report

This morning's mining stocks...

Barrick (ABX) $43.86 up 0.02%
Newmont (NEM) $53.91 up 0.13%
McEwen Mining (MUX) 4.21 down 0.24% (formerly US Gold, UXG)
General Moly (Eureka Moly, LLC) (GMO) $3.33 down 0.89%
Thompson Creek (TC) $7.06 up 0.43%
Freeport-McMoRan (FCX) $38.36 up 0.03% (a bellwether mining stock spanning copper, gold & molybdenum)
Quadra FNX (TSE:QUX) $n/a
Timberline Resources (TLR) $0.52 unchanged

The Steels  (a "tell" for General Moly & Thompson Creek):

ArcelorMittal (MT) $20.87 up 1.31% - global steel producer
POSCO (PKX) $89.04 unchanged - South Korean integrated steel producer

The Eureka Miner's Index© (EMI) was re-calibrated 2/8 to reflect current 200-day moving averages for benchmark miners.

The EMI is above-par at 200.14, up from last report's 192.57 and below the 1-month moving average of 206.82. The 1-month average is falling but still above the key 100-level.

The EMI gives us the market temperature for the factors that have the greatest impact on mining in Eureka County. The record 2010-2012 high for the EMI is 816.78 set 01/04/2011; the low was set 10/4/2011 at 22.88. An EMI of 100 is the boundary between hot and cold markets for the metals & miners.

Gold & Silver Report

This morning's...

COMEX gold is down $15.9/oz at $1,643.6/oz (April contract, most active)

COMEX silver is down $0.331/oz at $32.395/oz (May contract, most active)

The gold-to-silver ratio (Au:Ag) is 50.736 oz/oz

Silver 1-month CRS© is 1.95% (bullish level); CRS© stalled divergence (Ag neutral)

The Eureka Miner’s Gold Value Index© (GVI) is below-par at 86.10, down from last report's 86.72 and below its 1-month average of 89.66. Gold value is now solidly trending down. The record high for 2010-2012 is 109.97 set on Oct. 4, 2011.

The Value Adjusted Gold Price© (VAGP) is $1,584.7/oz which is only $59.9/oz below the current COMEX gold price.

The GVI gauges the value of gold in relation to oil, copper and silver independent of currency. These three commodities were chosen for relative value comparison because 1) oil derivatives are a common cost element for all miners, 2) copper has proven to be a reliable proxy for global growth and 3) silver is a precious and industrial metal that now competes with gold for investment and as a hedge against fiat currencies.

The Value Adjusted Gold Price (VAGP) is a level that supports current oil, copper & oil prices based on historical commodity norms. If the daily COMEX price is less than the VAGP, then gold is undervalued; if above, overvalued.

Copper & Molybdenum Report

This morning's...

COMEX copper is up $0.0315/lb at $3.9290/lb (May contract, most active)

The gold-to-copper ratio is 418.13 lb/oz; ratios in excess of 400 lb/oz are considered "recession levels"; the ratio is below its 3-month moving average of 452.79 (Cu bullish trend emerging in Price Domain B)

Copper 1-month CRS© is 3.03% (bullish level); divergent, compressing ratio(Cu bullish)

The latest molybdenum oxide spot and futures prices (courtesy of Thompson Creek Metals):

Metals Week Average:
US$14.125
As of March 19, 2012
(updated weekly)

Ryan's Notes Average:
US$14.30
As of March 13, 2012
(updated twice weekly)

European Molybdenum Oxide (Bloomberg average price, updated Wednesday & Friday):
US$14.15/lb

London metal Exchange (LME) molybdenum 3-month seller's contract:

US$14.52/lb (US$32,000/metric ton)

Daily Oil Watch

Latest Nevada Fuel Prices (click this link)

On February 1st, 2011, we identified North Sea Brent crude oil as a good barometer for the crises in the Middle East and North Africa (MENA). The next conflict could be in the Persian Gulf. Brent remains above $120/bbl maintaining a spread above the North American benchmark, Western Texas Intermediate or "Texas light sweet crude", traded on the NYMEX.

Here are the key front-month contracts this morning:

NYMEX light sweet crude $105.86
ICE North Sea Brent crude $123.96
Spread (ICE- NYMEX) = $18.10 (last report, $18.34)

Here are the June contracts* with a narrower spread:

NYMEX light sweet crude $106.92
ICE North Sea Brent crude $122.95
Spread (ICE- NYMEX) = $16.03 (last report, $16.85)

* NYMEX futures contracts have rolled forward, we now show April and June for a 2-month look-ahead

NYMEX WTI 1-month CRS© is 2.74% (bullish level); CRS© divergent (Oil bearish)

Prices are near highs for 2012, we have $120+ Brent and $105+ NYMEX in June favoring high oil prices this spring into summer. A front-month spread between Brent and WTI >$20/bbl is a trouble sign, OK for now but getting closer.

Daily Debt Crisis Watch

July 26th we introduced the Debt Crisis Index (DCI). The DCI is computed in the mornings and at the market close Friday in much the same way we do the EMI and GVI indices. Today, the DCI is 71.2 up from last report's 67.4. A level above 200 is time for serious concern - we are now well below that level. The highest level recorded since inception was 271.0 Aug. 9, 2011; the lowest level is 65.1 on Mar. 13, 2012

Global sovereign debt issues have been an overhang on markets for many, many months starting with the Dubai crisis in late November, 2009 and spreading to the euro-zone in 2010-2011 and continuing into 2012.

Stock Market Morning Update

The DOW is up 6.69 to 13,529.45; the S&P 500 is up 1.67 points at 1,404.27

The Eureka Miner's Grubstake Portfolio is up 0.04% at $1,462,836.35 (what's this?).

Cheers,

Colonel Possum

Headline photograph by Mariana Titus

Write Colonel Possum at colonelpossum@gmail.com for answers to your questions or to request e-mail updates on the market

Thursday, March 15, 2012

Miners 2012 - St. Paddy Fuel Bet; Timberline-South Eureka Update

Devonian Shore, Devil's Gate, Eureka, Nevada


Latest Nevada Fuel Prices (click this link)

NEW FORMAT for 2012

Morning Commentary
Daily Market Roundup
- Gold & Silver Report
- Copper & Molybdenum Report
- Oil Watch
- Debt Crisis Watch
- Stock Market Morning Update
- Eureka Miner's Million Dollar Grubstake Portfolio


My latest Kitco commentary: Silver & Copper 2012 - A Tale of Two Metals (03/05/2012)

My Latest International Business Times commentary: Silver to Gold, “Whither Thou Goest…” (02/27/2011)

This morning's...
COMEX Gold price = $1,644.6/oz (April contract most active)
Eureka Miner’s Gold Value Index© (GVI) = 86.72 (gold value trending down)
Value Adjusted Gold Price© (VAGP) = $1,584.7/oz
COMEX - VAGP = $59.9/oz; gold is trading at a declining premium to key commodities; the gold-to-copper ratio remains below its 3-month average and compressing (Cu bullish)


Þūnresdæg
Morning Miners!

It is 6:22 AM. Have a cup of Thor's Four-Leaf Clover coffee - make a wish and wake up to the last Thorsday before St. Paddy's. Gold prices aren't crashing this morning so let's tiptoe back to our Miners 2012 series and see if we can win a bar bet on fuel costs.

Miners 2012 - St. Paddy Fuel Bet

Last year St. Patrick's Day was on a Thursday. We've thrown in a leap day since so this year wears the green on Saturday. Today's a Thursday and the ole Colonel thought it would be fun to do a St. Paddy fuel cost comparison for our three benchmark miners (a couple of day's off is close enough for this Welsh-Irish-Norwegian). There's even a fun beer bet in this comparison - ask your drinking buddy the question, "In terms of their primary product, who pays more for fuel now than a year ago - gold, copper or moly miners?"

To answer this question I chose a barrel of Brent north sea crude oil because all petroleum derivatives like diesel start with crude and a large and growing percentage of their cost is driven by the price of the black gooey stuff. Brent is also considered to be a global benchmark.

Here's a comparison of prices now and last St. Paddy's Day; Brent crude and the miner's primary products - gold, copper and molybdenum oxide. Moly prices are the average of Western and European spot prices. COMEX most active contracts set the prices for gold & copper and the ICE futures for Brent.

Brent crude $113.12/bbl (3/17/2011) $124.43/bbl (today)
Gold $1,400.9/oz (3/17/2011) $1,644.6/oz (today)
Copper $4.300/lb (3/17/2011) $3.8685/lb (today)
Moly oxide $17.00/lb (3/17/2011) $14.25/lb (today)

Answering our question boils down to figuring how many pounds or ounces of product it takes to buy a barrel of oil then and now, and calculating the one-year percentage change. For example, for copper miners it took 26 pounds of copper to buy one barrel of oil a year ago; today it takes 32 pounds, a relative cost increase of 22%. Here are the results for all three:

Gold miners 0.0808 oz/bbl (3/17/2011) 0.0757 oz/bbl (today) down 6.3%
Copper miners 26.3 lb/bbl (3/17/2011) 32.2 lb/bbl (today) up 22.35%
Moly Miners 6.65 lb/bbl (3/17/2011) 8.73 lb/bbl (today) up 31.2%

There you have it. In theory, gold miners actually pay less than a year ago and moly miners pay a lot more than the other two. The rise in crude oil price over this period is 10% in U.S. dollar terms so copper and moly miners are both paying a healthy premium for oil in terms of their product; and gold miners, a discount.

This is, of course, a rough comparison and ignores all sorts of details about how much fuel is required to mine each product, fuel hedging strategies, electric/diesel mix etc. It is useful exercise to make the point that $124/bbl crude oil prices do not impact all miners the same at least in terms of their product price...Oh, and also to win that bar bet.

Timberline-South Eureka Update

Mining editor Adella Harding of the Elko Daily Free Press wrote a nice piece on Timberline Resources (TLR) recent purchase of 19 claims (211 acres) in South Eureka. Old timers will take delight in knowing this includes some of the old Windfall mine properties. TLR is part of our Eureka Miner's Grubstake Portfolio.

Timberline buys 19 claims (Adella Harding, Elko Daily Free Press, Wednesday, March 14, 2012 6:03 pm)

Daily Market Roundup


Mining Report

This morning's mining stocks...

Barrick (ABX) $43.73 up 0.95%
Newmont (NEM) $54.31 up 0.02%
McEwen Mining (MUX) 4.23 up 0.71% (formerly US Gold, UXG)
General Moly (Eureka Moly, LLC) (GMO) $3.34 up 0.60%
Thompson Creek (TC) $7.04 up 0.14%
Freeport-McMoRan (FCX) $38.68 up 1.47% (a bellwether mining stock spanning copper, gold & molybdenum)
Quadra FNX (TSE:QUX) $n/a
Timberline Resources (TLR) $0.50 down 1.96%

The Steels  (a "tell" for General Moly & Thompson Creek):

ArcelorMittal (MT) $20.37 up 1.24% - global steel producer
POSCO (PKX) $88.77 up 0.16% - South Korean integrated steel producer

The Eureka Miner's Index© (EMI) was re-calibrated 2/8 to reflect current 200-day moving averages for benchmark miners.

The EMI is above-par at 192.57, down from last report's 201.14 and below the 1-month moving average of 208.42. The 1-month average is falling but still above the key 100-level.

The EMI gives us the market temperature for the factors that have the greatest impact on mining in Eureka County. The record 2010-2012 high for the EMI is 816.78 set 01/04/2011; the low was set 10/4/2011 at 22.88. An EMI of 100 is the boundary between hot and cold markets for the metals & miners.

Gold & Silver Report

This morning's...

COMEX gold is up $1.7/oz at $1,644.6/oz (April contract, most active)

COMEX silver is up $0.059/oz at $32.240/oz (May contract, most active)

The gold-to-silver ratio (Au:Ag) is 51.011 oz/oz

Silver 1-month CRS© is 1.97% (bullish level); CRS© divergent (Ag bearish)

The Eureka Miner’s Gold Value Index© (GVI) is below-par at 86.72, up from last report's 86.38 and below its 1-month average of 89.93. Gold value is now solidly trending down after briefly trending up mid-month. The record high for 2010-2012 is 109.97 set on Oct. 4, 2011.

The Value Adjusted Gold Price© (VAGP) is $1,584.7/oz which is only $59.9/oz below the current COMEX gold price.

The GVI gauges the value of gold in relation to oil, copper and silver independent of currency. These three commodities were chosen for relative value comparison because 1) oil derivatives are a common cost element for all miners, 2) copper has proven to be a reliable proxy for global growth and 3) silver is a precious and industrial metal that now competes with gold for investment and as a hedge against fiat currencies.

The Value Adjusted Gold Price (VAGP) is a level that supports current oil, copper & oil prices based on historical commodity norms. If the daily COMEX price is less than the VAGP, then gold is undervalued; if above, overvalued.

Copper & Molybdenum Report

This morning's...

COMEX copper is up $0.0205/lb at $3.8685/lb (May contract, most active)

The gold-to-copper ratio is 425.13 lb/oz; ratios in excess of 400 lb/oz are considered "recession levels"; the ratio is below its 3-month moving average of 453.83 (Cu bullish trend emerging in Price Domain B)

Copper 1-month CRS© is 2.67% (bullish level); 1-month & 3-month CRS© < 3%, divergent, compressing ratio(Cu bullish)

The latest molybdenum oxide spot and futures prices (courtesy of Thompson Creek Metals):

Metals Week Average:
US$14.40
As of March 12, 2012
(updated weekly)

Ryan's Notes Average:
US$14.30
As of March 13, 2012
(updated twice weekly)

European Molybdenum Oxide (Bloomberg average price, updated Wednesday & Friday):
US$14.15/lb

London metal Exchange (LME) molybdenum 3-month seller's contract:

US$14.52/lb (US$32,000/metric ton)

Daily Oil Watch

Latest Nevada Fuel Prices (click this link)

On February 1st, 2011, we identified North Sea Brent crude oil as a good barometer for the crises in the Middle East and North Africa (MENA). The next conflict could be in the Persian Gulf. Brent remains above $120/bbl maintaining a spread above the North American benchmark, Western Texas Intermediate or "Texas light sweet crude", traded on the NYMEX.

Here are the key front-month contracts this morning:

NYMEX light sweet crude $106.09
ICE North Sea Brent crude $124.43
Spread (ICE- NYMEX) = $18.34 (last report, $19.60)

Here are the June contracts* with a narrower spread:

NYMEX light sweet crude $107.11
ICE North Sea Brent crude $123.96
Spread (ICE- NYMEX) = $16.85 (last report, $17.71)

* NYMEX futures contracts have rolled forward, we now show April and June for a 2-month look-ahead

NYMEX WTI 1-month CRS© is 2.77% (bullish level); CRS© divergent (Oil bearish)

Prices are near highs for 2012, we have $120+ Brent and $105+ NYMEX in June favoring high oil prices this spring into summer. A front-month spread between Brent and WTI >$20/bbl is a trouble sign, OK for now but getting closer.

Daily Debt Crisis Watch

July 26th we introduced the Debt Crisis Index (DCI). The DCI is computed in the mornings and at the market close Friday in much the same way we do the EMI and GVI indices. Today, the DCI is 71.2 up from last report's 67.4. A level above 200 is time for serious concern - we are now well below that level. The highest level recorded since inception was 271.0 Aug. 9, 2011; the lowest level is 65.1 on Mar. 13, 2012

Global sovereign debt issues have been an overhang on markets for many, many months starting with the Dubai crisis in late November, 2009 and spreading to the euro-zone in 2010-2011 and continuing into 2012.

Stock Market Morning Update

The DOW is down 8.74 to 13,185.13; the S&P 500 is up 0.41 points at 1,394.69

The Eureka Miner's Grubstake Portfolio is up 0.28% at $1,455,768.69 (what's this?).

Cheers,

Colonel Possum

Headline photograph by Mariana Titus

Write Colonel Possum at colonelpossum@gmail.com for answers to your questions or to request e-mail updates on the market

Wednesday, March 14, 2012

Gold Drops $55; Copper & Silver Resilient; General Moly (GMO) on Moly

School's Out, Eureka, Nevada

Latest Nevada Fuel Prices (click this link)

NEW FORMAT for 2012

Morning Commentary
Daily Market Roundup
- Gold & Silver Report
- Copper & Molybdenum Report
- Oil Watch
- Debt Crisis Watch
- Stock Market Morning Update
- Eureka Miner's Million Dollar Grubstake Portfolio


My latest Kitco commentary: Silver & Copper 2012 - A Tale of Two Metals (03/05/2012)

My Latest International Business Times commentary: Silver to Gold, “Whither Thou Goest…” (02/27/2011)

This morning's...
COMEX Gold price = $1,643.8/oz (April contract most active)
Eureka Miner’s Gold Value Index© (GVI) = 86.13 (gold value trending down)
Value Adjusted Gold Price© (VAGP) = $1,594.7/oz
COMEX - VAGP = $49.1/oz; gold is trading at a declining premium to key commodities; the gold-to-copper ratio remains below its 3-month average and compressing (Cu bullish)


Wōdnesdæg
Morning Miners!

It is 6:10 AM. Have a hot cup of Bad News Bears. I can't imagine a worse day for Old Miner Woden. Our market bear awoke to find his beloved gold falling down the price mineshaft while broader markets soar.

Yesterday the DOW and NASDAQ hit multi-year highs closing above key psychological levels of 13,000 and 3,000 respectively. To give that milestone proper perspective, the last time the Nasdaq Composite closed above 3,000 was Dec. 11, 2000. The S&P 500 may very well break 1,400 today. Tuesday also recorded the biggest one-day gains for the year bouncing on strong retail sales and the Federal Reserve's upbeat outlook on the economy. Most U.S. Banks passed new stress tests and have been given the all-clear for increasing dividends or stock buy-backs. Good news is bursting out all over.

Old Miner Woden just slammed the break room door - he is in full retreat to his cave. Safe-haven assets like gold and Treasuries are getting hammered as investors pile into riskier assets. When Woden and I lit the fire at 5:30 AM, COMEX gold was down $55 per ounce at an alarming $1,639.20. It has come up some now to trade at $1,643.8 per ounce. Last Friday, the ole Colonel said we may see $1,650 per ounce glitter this week - earlier today gold passed that key-level like a high-speed train.

Meanwhile, copper and silver bump down to lower prices in a slow moving ore cart - that's actually good news for them. Currently, COMEX copper is down a nickel at $3.8550 per pound and COMEX silver is off 73 cents at $32.850 per ounce. Both the red and white metal have shown recent price resilience with respect to the lustrous patriarch. The closely watched gold-to-silver ratio has compressed to 50.0 and gold-to-copper ratio is moving closer to the bull/bear threshold of 400 pounds per ounce; this morning falling to 426 lbs per ounce (the lower of either ratios indicates price strength relative to gold). I plan to write a Kitco commentary on the recent progress of both metals soon.

The broader markets are now open and it looks like we're up and away except for most mining stocks. Base metals are trading lower on a strong U.S. dollar and Chinese demand concerns. Our three benchmark miners are singing the blues - Barrick Gold (ABX) is off 3%; Freeport-McMoRan (FCX), 0.8% and Thompson Creek TC), 1.40%. General Moly (GMO) is sagging 2.3%.

It's probably my hangup but I dread bull runs led by technology stocks! I think I'll join Woden in the cave this afternoon. Before we leave the break room I did get some very encouraging news from General Moly yesterday...

General Moly (GMO) on Moly

After the dust settles from all this new found market exuberance, we'll return to our series on the benchmark miners. One key factor in our investigation is the price of their products. With respect to molybdenum, I said Monday:

Although the price moves are small, European ($14.35 per pound) and Western spot moly prices ($14.30 to $14.40 per pound) are in decline and below the London Metal Exchange (LME) 3-month seller contract at $14.51 per pound. This combination is bearish for moly miners who had been enjoying a nice trek back towards $15 per pound pasture in February. Look for LME futures prices to drop... (Eureka Miner, March 12, 2012)

Yesterday the LME 3-month contract did indeed drop to $14.06 per pound ($31,000 per metric ton). Euro-moly oxide dipped to $14.15 per pound (see report below).

I occasionally check my outlook with Seth Foreman at General Moly to make sure I'm not too far out in left field. In this case, it seems the Colonel may have wandered into the bleachers. Here is Seth's thoughtful reply to my outlook:

It’s always a bit discouraging to see the market turn lower, but I don’t necessarily see it as an indication of the relative health of the market. The market is very quiet right now – very few trades going on. Most consumers are being fully supplied under long-term contracts and are not in the spot market right now buying any material. That leaves relatively few traders to move the price up and down in an illiquid market – that is what is happening here. The same traders that drove prices higher over the last couple months are seeing the price reaching an (intermediate) inflection point and start to head lower, so traders are jumping in and taking their gains (even at $14.50 - $15). Many of these traders had inventory in the $12-13’s from late last year, so these sales are still profitable. It’s a bit like momentum traders in stocks really – not necessarily indicative of the value of the company, just people taking advantage of pricing trends and momentum.

Fundamentally, we think the high-end of the Chinese cash cost curve is in the $10-$14/lb range. That should provide a natural floor price for moly in that price range as small Chinese producers would become uneconomic and come off-line if prices were in that range for a prolonged period of time. That is what we saw in 2008-2009 and with China recently raising resource taxes on moly producers, and input costs (labor, electricity, and oil) all headed higher, Chinese cost structures are only moving up. That should be supportive of moly prices.


OK, I feel better. Seth also sent me a detailed commodity briefing by JP Morgan and pointed out that, "...they are forecasting billions of dollars to be spent on energy-supply infrastructure in the next 20 years, with North America leading the way. This is part the exploitation of our huge natural gas reserves but also the replacement of an increasingly old and decrepit energy infrastructure."

In turns out that OCTG (Oil Country Tubular Goods) tons of steel per drill well in shale is 190 tons versus 45 tons in a conventional oil well, over four times. The cool thing is that moly plays a significant role in OCTG steel. Importantly, JP Morgan ranks molybdenum as one one their their favorite metals for the 21st century.

Boy, I feel a lot better. Would somebody take the flame off those bubbling technology stocks, there's some serious moly mining to be done!

Daily Market Roundup


Mining Report

This morning's mining stocks...

Barrick (ABX) $43.99 down 3.00%
Newmont (NEM) $54.13 down 1.33%
McEwen Mining (MUX) 4.35 down 5.64% (formerly US Gold, UXG)
General Moly (Eureka Moly, LLC) (GMO) $3.45 down 2.27%
Thompson Creek (TC) $7.05 down 1.40%
Freeport-McMoRan (FCX) $38.78 down 0.79% (a bellwether mining stock spanning copper, gold & molybdenum)
Quadra FNX (TSE:QUX) $n/a
Timberline Resources (TLR) $0.53 unchanged

The Steels  (a "tell" for General Moly & Thompson Creek):

ArcelorMittal (MT) $20.54 up 0.64% - global steel producer
POSCO (PKX) $89.18 down 0.65% - South Korean integrated steel producer

The Eureka Miner's Index© (EMI) was re-calibrated 2/8 to reflect current 200-day moving averages for benchmark miners.

The EMI is above-par at 201.14, down from last report's 207.95 and below the 1-month moving average of 211.35. The 1-month average is falling but still above the key 100-level.

The EMI gives us the market temperature for the factors that have the greatest impact on mining in Eureka County. The record 2010-2012 high for the EMI is 816.78 set 01/04/2011; the low was set 10/4/2011 at 22.88. An EMI of 100 is the boundary between hot and cold markets for the metals & miners.

Gold & Silver Report

This morning's...

COMEX gold is down $50.4/oz at $1,643.8/oz (April contract, most active)

COMEX silver is down $0.731/oz at $32.850/oz (May contract, most active)

The gold-to-silver ratio (Au:Ag) is 50.040 oz/oz

Silver 1-month CRS© is 1.98% (bullish level); CRS© divergent, compressing ratio (Ag bullish)

The Eureka Miner’s Gold Value Index© (GVI) is below-par at 86.13, down from last report's 88.30 and below its 1-month average of 90.45. Gold value is now solidly trending down after briefly trending up mid-month. The record high for 2010-2012 is 109.97 set on Oct. 4, 2011.

The Value Adjusted Gold Price© (VAGP) is $1,594.7/oz which is only $49.1/oz below the current COMEX gold price.

The GVI gauges the value of gold in relation to oil, copper and silver independent of currency. These three commodities were chosen for relative value comparison because 1) oil derivatives are a common cost element for all miners, 2) copper has proven to be a reliable proxy for global growth and 3) silver is a precious and industrial metal that now competes with gold for investment and as a hedge against fiat currencies.

The Value Adjusted Gold Price (VAGP) is a level that supports current oil, copper & oil prices based on historical commodity norms. If the daily COMEX price is less than the VAGP, then gold is undervalued; if above, overvalued.

Copper & Molybdenum Report

This morning's...

COMEX copper is up $0.0.0475/lb at $3.8550/lb (May contract, most active)

The gold-to-copper ratio is 426.41 lb/oz; ratios in excess of 400 lb/oz are considered "recession levels"; the ratio is below its 3-month moving average of 454.81 (Cu bullish trend emerging in Price Domain B)

Copper 1-month CRS© is 2.11% (bullish level); 1-month & 3-month CRS© < 3%, divergent, compressing ratio(Cu bullish)

The latest molybdenum oxide spot and futures prices (courtesy of Thompson Creek Metals):

Metals Week Average:
US$14.40
As of March 12, 2012
(updated weekly)

Ryan's Notes Average:
US$14.30
As of March 13, 2012
(updated twice weekly)

European Molybdenum Oxide (Bloomberg average price, updated Wednesday & Friday):
US$14.15/lb

London metal Exchange (LME) molybdenum 3-month seller's contract:

US$14.06/lb (US$31,000/metric ton)

Daily Oil Watch

Latest Nevada Fuel Prices (click this link)

On February 1st, 2011, we identified North Sea Brent crude oil as a good barometer for the crises in the Middle East and North Africa (MENA). The next conflict could be in the Persian Gulf. Brent remains above $120/bbl maintaining a spread above the North American benchmark, Western Texas Intermediate or "Texas light sweet crude", traded on the NYMEX.

Here are the key front-month contracts this morning:

NYMEX light sweet crude $106.17
ICE North Sea Brent crude $125.77
Spread (ICE- NYMEX) = $19.60 (last report, $18.68)

Here are the June contracts* with a narrower spread:

NYMEX light sweet crude $107.20
ICE North Sea Brent crude $124.91
Spread (ICE- NYMEX) = $17.71 (last report, $17.7)

* NYMEX futures contracts have rolled forward, we now show April and June for a 2-month look-ahead

NYMEX WTI 1-month CRS© is 2.95% (bullish level); CRS© weak convergence (Oil neutral)

Prices are near highs for 2012, we have $120+ Brent and $105+ NYMEX in June favoring high oil prices this spring into summer. A front-month spread between Brent and WTI >$20/bbl is a trouble sign, OK for now but getting closer.

Daily Debt Crisis Watch

July 26th we introduced the Debt Crisis Index (DCI). The DCI is computed in the mornings and at the market close Friday in much the same way we do the EMI and GVI indices. Today, the DCI is 67.4 up from last report's 65.1. A level above 200 is time for serious concern - we are now well below that level. The highest level recorded since inception was 271.0 Aug. 9, 2011; the lowest level is 65.1 on Mar. 13, 2012

Global sovereign debt issues have been an overhang on markets for many, many months starting with the Dubai crisis in late November, 2009 and spreading to the euro-zone in 2010-2011 and continuing into 2012.

Stock Market Morning Update

The DOW is up 34.28 to 13,211.96; the S&P 500 is up 2.60 points at 1,398.55

The Eureka Miner's Grubstake Portfolio is down 1.57% at $1,474,024.83 (what's this?).

Cheers,

Colonel Possum

Headline photograph by Mariana Titus

Write Colonel Possum at colonelpossum@gmail.com for answers to your questions or to request e-mail updates on the market

