"The history of Eureka lies in its future." - Lambert Molinelli, 1878

DISCLOSURE

The author/editor of the Eureka Miner owns common shares of local mining stocks, McEwen Mining (MUX) and General Moly (GMO). Please do your own research, markets can turn on you faster than a feral cat.

Tuesday, May 8, 2012

Gold Drops below $1,600; Thompson Creek (TC) Falling Knife

Window Sheet, Eureka Nevada

Latest Nevada Gas Prices (click this link)

NEW FORMAT for 2012

Morning Commentary
Daily Market Roundup
- Gold & Silver Report
- Copper & Molybdenum Report
- Oil Watch
- Debt Crisis Watch
- Stock Market Morning Update
- Eureka Miner's Million Dollar Grubstake Portfolio


My latest Kitco commentary: Are Gold and Silver Parting Ways? (5/07/2012)

This morning's...
COMEX Gold price = $1,602.6/oz (June contract most active)
Eureka Miner’s Gold Value Index© (GVI) = 91.46 (gold value gaps up, 5/4)
Value Adjusted Gold Price© (VAGP) = $1,464.0/oz
COMEX - VAGP = $138.6/oz; gold is trading at a premium to key commodities; the gold-to-copper ratio remains below its 3-month average (weakly bullish condition, Cu overall bearish)


Morning Miners!

It is 5:55 AM. Have a lonesome cup of Ruby T's Blue Sky java - looks the Greeks put clouds in her brew this morning. Ruby called in sick and the ole Colonel just can't percolate much market optimism from her famous brew...

Gold Drops below $1,600; Thompson Creek (TC) Falling Knife

Some mornings you just can't write fast enough to follow market drops. When I started, COMEX gold had just plumbed a low of $1,608.8 per ounce at 5:00 AM PDT; an hour later gold dropped below $1,600 per ounce to $1,599.30 per ounce. Then I ran my morning calculations at 6:21 AM EDT and COMEX gold had rallied up a bit at $1,613.4 per ounce.

Things were changing to the downside so rapidly, the ole Colonel re-ran everything at 7:40 AM as COMEX gold traded at 1,602.6 per ounce - that's it for now. COMEX silver touched $29.25 per ounce before coming back up a bit to $29.325; COMEX copper is down more than a dime at $3.6650 per pound. Ouch!

Talk about catching falling knifes - our benchmark moly miner Thompson Creek (TC) is down nearly 9% at a scary $4.23 per share; General moly (GMO) is faring a little better down 2.8% at $2.77. To give that a sobering perspective TC closed at $9.03 on Feb. 8 and GMO closed at $4.08 on Feb. 3; now, down 53% and 32% respectively. Ouch-ouch!

Barrick gold is doing a little better trading down 3.2% today at $35.15 and our bellwether miner Freeport-McMoRan (FCX) is off 3.4% at $35.15. ABX is down 26% from its Feruary high and FCX is down 24% from its January peak - sometimes it's nice to be a big dog, at least relatively speaking.

Who's the culprit? The Greeks of course! U.S. markets followed Europe lower as worries increased about political turmoil in Greece even though we had a rise in U.S. small-business confidence this morning. The post-election fallout in Greece has many worrying that it will lead to expulsion from the countries that share the euro currency. Needless to say, euro down, U.S. dollar up and dollar-denominated metals in a tailspin of woe.

Oh, here's a ray of light - POSCO(PKX), South Korean steelmaker and 20% owner of the Mt. Hope molybdenum project, is one of the few stocks in the green today - up 0.62% at $82.78. Here's an upbeat assessment of the steel industry from steel giant ArcelorMittal ADS (MT):

ArcelorMittal sees 2012 steel use up 4 to 4.5 pct (LUXEMBOURG, Reuters, May 8,2012)

Nuts. The Colonel thinks this whole Greek thing is overdone (again) - I'm going to give Ruby a get well call.

Mining Report

This morning's mining stocks...

Barrick (ABX) $36.73 down 3.19%
Newmont (NEM) $44.78 down 2.95%
McEwen Mining (MUX) 3.02 down 5.63% (formerly US Gold, UXG)
General Moly (Eureka Moly, LLC) (GMO) $2.77 down 2.81%
Thompson Creek (TC) $4.23 down 8.84%
Freeport-McMoRan (FCX) $35.15 down 3.43% (a bellwether mining stock spanning copper, gold & molybdenum)
Timberline Resources (TLR) $0.39 unchanged

The Steels  (a "tell" for General Moly & Thompson Creek):

ArcelorMittal (MT) $15.99 down 4.19% - global steel producer
POSCO (PKX) $82.78 up 0.62% - South Korean integrated steel producer

The Eureka Miner's Index© (EMI) was re-calibrated 2/8 to reflect current 200-day moving averages for benchmark miners.

The EMI is below-par at 63.47, down from last report's 85.82 and below the 1-month moving average of 116.22. The 1-month average is falling but still above the key 100-level.

The EMI gives us the market temperature for the factors that have the greatest impact on mining in Eureka County. The record 2010-2012 high for the EMI is 816.78 set 01/04/2011; the low was set 10/4/2011 at 22.88. An EMI of 100 is the boundary between hot and cold markets for the metals & miners.

Gold & Silver Report

This morning's...

COMEX gold is down $36.5/oz at $1,602.6/oz (June contract, most active)

COMEX silver is down $0.797/oz at $29.430/oz (July contract, most active)

The gold-to-silver ratio (Au:Ag) is 54.822 oz/oz

Silver 1-month CRS© is 1.66% (bullish stability level); very stable ratio; 1-month & 3-month < 3% but divergent trend is in place (Ag overall indicators bearish)

The Eureka Miner’s Gold Value Index© (GVI) is below-par at 91.46, down from last report's 91.77 and above its 1-month average of 90.28. Gold value gaped up Friday, 5/4/2012, which could be a bearish indication for key commodities. The record high for 2010-2012 is 109.97 set on Oct. 4, 2011.

The Value Adjusted Gold Price© (VAGP) is $1,464.0/oz which is $138.6/oz below the current COMEX gold price.

The GVI gauges the value of gold in relation to oil, copper and silver independent of currency. These three commodities were chosen for relative value comparison because 1) oil derivatives are a common cost element for all miners, 2) copper has proven to be a reliable proxy for global growth and 3) silver is a precious and industrial metal that now competes with gold for investment and as a hedge against fiat currencies.

The Value Adjusted Gold Price (VAGP) is a level that supports current oil, copper & oil prices based on historical commodity norms. If the daily COMEX price is less than the VAGP, then gold is undervalued; if above, overvalued.

Copper & Molybdenum Report

This morning's...

COMEX copper is down $0.1085/lb at $3.6650/lb (July contract, most active)

The gold-to-copper ratio is 437.27 lb/oz; ratios in excess of 400 lb/oz are indicative of a bearish price domain; the ratio is below its 3-month moving average of 443.22 (Cu weekly bullish condition in a bearishPrice Domain B)

Copper 1-month CRS© is 1.69% (bullish stability level); very stable ratio; 1-month & 3-month < 3% (overall indicators bearish)

The latest molybdenum oxide spot and futures prices (courtesy of Thompson Creek Metals):

Metals Week Average:
US$14.15
As of May 7, 2012
(updated weekly)

Ryan's Notes Average:
US$14.20
As of May 4, 2012
(updated twice weekly)

European Molybdenum Oxide (Bloomberg average price, updated Wednesday & Friday):
US$14.15/lb

London metal Exchange (LME) molybdenum 3-month seller's contract:

US$14.29/lb (US$31,500/metric ton)

Daily Oil Watch

Latest Nevada Gas Prices (click this link)

Understanding the Price of Oil (click this link for a quick overview on crude oil prices)

On February 1st, 2011, we identified North Sea Brent crude oil as a good barometer for the crises in the Middle East and North Africa (MENA). The next conflict could be in the Persian Gulf. Brent remains above $110/bbl maintaining a spread above the North American benchmark, Western Texas Intermediate or "Texas light sweet crude", traded on the NYMEX.

Here are the key front-month contracts this morning:

NYMEX light sweet crude $96.83
ICE North Sea Brent crude $111.46
Spread (ICE- NYMEX) = $14.63 (last report, $15.08)

Here are the August contracts* with a narrower spread:

NYMEX light sweet crude $97.09
ICE North Sea Brent crude $110.86
Spread (ICE- NYMEX) = $13.77 (last report, $13.68)

* NYMEX futures contracts have rolled forward, we now show June and August.

NYMEX WTI 1-month CRS© is 1.82% (bullish stability level); CRS© divergence (Oil bearish overall)

Prices remain high for 2012 but have pulled back dramatically, we have $110+ Brent and $95+ NYMEX in August still favoring high oil prices this summer. A front-month spread between Brent and WTI >$20/bbl is a trouble sign.

Daily Debt Crisis Watch

July 26th we introduced the Debt Crisis Index (DCI). The DCI is computed in the mornings and at the market close Friday in much the same way we do the EMI and GVI indices. Today, the DCI is 79.7 up from last report's 79.1. A level above 200 is time for serious concern - we are now well below that level. The highest level recorded since inception was 271.0 Aug. 9, 2011; the lowest level is 65.1 on Mar. 13, 2012

Global sovereign debt issues have been an overhang on markets for many, many months starting with the Dubai crisis in late November, 2009 and spreading to the euro-zone in 2010-2011 and continuing into 2012.

Stock Market Morning Update

The DOW is down 161.36 points to 12,847.17; the S&P 500 is down 17.52 points at 1,352.06

The Eureka Miner's Grubstake Portfolio is down 2.60% at $1,251,145.31 (what's this?).

Cheers,

Colonel Possum

Headline photograph by Mariana Titus

Write Colonel Possum at colonelpossum@gmail.com for answers to your questions or to request e-mail updates on the market

Monday, May 7, 2012

Miners Tumble; Are Gold and Silver Parting Ways?

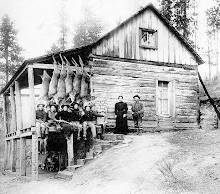
Mining Memories, Eureka, Nevada

Latest Nevada Gas Prices (click this link)

NEW FORMAT for 2012

Morning Commentary
Daily Market Roundup
- Gold & Silver Report
- Copper & Molybdenum Report
- Oil Watch
- Debt Crisis Watch
- Stock Market Morning Update
- Eureka Miner's Million Dollar Grubstake Portfolio


My latest Kitco commentary: Are Gold and Silver Parting Ways? (5/07/2012)

This morning's...
COMEX Gold price = $1,638.3/oz (June contract most active)
Eureka Miner’s Gold Value Index© (GVI) = 91.77 (gold value gaps up, 5/4)
Value Adjusted Gold Price© (VAGP) = $1,491.6/oz
COMEX - VAGP = $146.7/oz; gold is trading at a premium to key commodities; the gold-to-copper ratio remains below its 3-month average (Cu weakly bullish)


Morning Miners!

It is 6:00 AM. Have a strong cup of Monday Ether - you may need it to start your internal diesel this morning!

Miners Tumble

Leftist party victories in France and Greece have pummeled the euro and strengthened the U.S. dollar - the future of austerity policies in either country is weighing heavily on the markets as dollar-denominated commodities and commodity-sensitive stocks are being roughed up. Gold and copper are showing brave resilience; most miners are not.

Dennis Gartman of the well respected Gartman Letter tells his readers this morning, "Political chaos now prevails and the dollar is very strong as investors are fleeing Europe and are seeking any safer ports that might be available to them in this strong and strengthening political storm..."

COMEX gold shaved 7 dollars to trade at $1,638.3 per ounce this morning; COMEX silver dropped $0.237 to $30.195 per ounce. Surprisingly, COMEX copper is showing price strength compared to either staying in the green 0.6 cents to trade at $3.7270 per ounce. Even though the red metal is up, copper giant and bellwether miner Freeport-McMoRan (FCX)is headed to lows not seen since late-2011 down 1.4% at $35.91 per share. Benchmark moly miner Thompson creek (TC) is faring even worse falling nearly 9% at $5.06. Barrick Gold (ABX), following gold's resilience, is down only 0.2% at $37.82.

Not surprisingly, this report's Eureka Miner's Index© (EMI) is spending its second consecutive day below the key 100-level presently registering a very bearish 85.82 compared to Friday's disappointing 95.41. Ouch.

Are Gold and Silver Parting Ways?

Kitco News just posted my latest commentary, Are Gold and Silver Parting Ways?. If your Monday is too hectic to read the entire article, here are my concluding remarks:

As reported by Kitco News on April 27, TD Securities made a prescient warning that its outlook for the silver market was negative near-term and suggested that the headwinds of a recessionary Europe, softening Chinese demand, fading investor interest and high inventories could return the white metal to $29 per ounce. Last Friday, silver prices did indeed dip briefly below $30 per ounce.

The above analysis demonstrates that silver and gold have moved rather abruptly from a point of relative price equilibrium to an elevated ratio presently above 54 - silver price strength relative to gold is in decline. If the ratio were to rise to the 57 levels of late-2011 and gold tests its April low, silver could easily return to $28 per ounce territory (i.e. $1,613 per ounce/57 = $28.3 per pounce). However, GSR stabilities remain “very stable” so it is unlikely that silver prices are on the verge of crashing as in 2011.

My view is that precious and base metals should enjoy a better second than first-half for 2012 and TD Securities turns bullish on silver in the next three quarters. For the time being it appears gold and silver have parted ways. In any case, Commodity Ratio Stability© analysis offers a powerful technique to track the next wiggle in their relative performance.


The referenced analysis explains the chart below and others addressing the gold-to-silver ratio level and stability (a larger and more readable chart can be found near the bottom of this blog page):


If you have a chance, give it a read on your break - tough times lately for the white metal but there may be better times ahead.

Daily Market Roundup


Mining Report

This morning's mining stocks...

Barrick (ABX) $37.82 down 0.18%
Newmont (NEM) $45.85 down 0.67%
McEwen Mining (MUX) 3.27 down 1.80% (formerly US Gold, UXG)
General Moly (Eureka Moly, LLC) (GMO) $2.88 down 0.69%
Thompson Creek (TC) $5.06 down 8.50%
Freeport-McMoRan (FCX) $35.91 down 1.35% (a bellwether mining stock spanning copper, gold & molybdenum)
Timberline Resources (TLR) $0.44 unchanged

The Steels  (a "tell" for General Moly & Thompson Creek):

ArcelorMittal (MT) $16.22 up 0.75% - global steel producer
POSCO (PKX) $81.55 up 0.62% - South Korean integrated steel producer

The Eureka Miner's Index© (EMI) was re-calibrated 2/8 to reflect current 200-day moving averages for benchmark miners.

The EMI is below-par at 85.82, down from last report's 95.41 and below the 1-month moving average of 119.82. The 1-month average is falling but still above the key 100-level.

The EMI gives us the market temperature for the factors that have the greatest impact on mining in Eureka County. The record 2010-2012 high for the EMI is 816.78 set 01/04/2011; the low was set 10/4/2011 at 22.88. An EMI of 100 is the boundary between hot and cold markets for the metals & miners.

Gold & Silver Report

This morning's...

COMEX gold is down $6.9/oz at $1,638.3/oz (June contract, most active)

COMEX silver is down $0.237/oz at $30.195/oz (July contract, most active)

The gold-to-silver ratio (Au:Ag) is 54.257 oz/oz

Silver 1-month CRS© is 1.64% (bullish stability level); very stable ratio; 1-month & 3-month < 3% but divergent trend is in place (Ag overall indicators bearish)

The Eureka Miner’s Gold Value Index© (GVI) is below-par at 91.77, down from last report's 91.78 and below its 1-month average of 90.12. Gold value gaped up Friday, 5/4/2012, which could be a bearish indication for key commodities. The record high for 2010-2012 is 109.97 set on Oct. 4, 2011.

The Value Adjusted Gold Price© (VAGP) is $1,491.6/oz which is $146.7/oz below the current COMEX gold price.

The GVI gauges the value of gold in relation to oil, copper and silver independent of currency. These three commodities were chosen for relative value comparison because 1) oil derivatives are a common cost element for all miners, 2) copper has proven to be a reliable proxy for global growth and 3) silver is a precious and industrial metal that now competes with gold for investment and as a hedge against fiat currencies.

The Value Adjusted Gold Price (VAGP) is a level that supports current oil, copper & oil prices based on historical commodity norms. If the daily COMEX price is less than the VAGP, then gold is undervalued; if above, overvalued.

Copper & Molybdenum Report

This morning's...

COMEX copper is up $0.0060/lb at $3.7270/lb (July contract, most active)

The gold-to-copper ratio is 439.58 lb/oz; ratios in excess of 400 lb/oz are indicative of a bearish price domian; the ratio is below its 3-month moving average of 443.33 (Cu bullish trend in a bearishPrice Domain B)

Copper 1-month CRS© is 1.91% (bullish stability level); very stable ratio; 1-month & 3-month < 3% (overall indicators weakly bullish)

The latest molybdenum oxide spot and futures prices (courtesy of Thompson Creek Metals):

Metals Week Average:
US$14.15
As of May 7, 2012
(updated weekly)

Ryan's Notes Average:
US$14.20
As of May 4, 2012
(updated twice weekly)

European Molybdenum Oxide (Bloomberg average price, updated Wednesday & Friday):
US$14.15/lb

London metal Exchange (LME) molybdenum 3-month seller's contract:

US$14.29/lb (US$31,500/metric ton)

Daily Oil Watch

Latest Nevada Gas Prices (click this link)

Understanding the Price of Oil (click this link for a quick overview on crude oil prices)

On February 1st, 2011, we identified North Sea Brent crude oil as a good barometer for the crises in the Middle East and North Africa (MENA). The next conflict could be in the Persian Gulf. Brent remains above $110/bbl maintaining a spread above the North American benchmark, Western Texas Intermediate or "Texas light sweet crude", traded on the NYMEX.

Here are the key front-month contracts this morning:

NYMEX light sweet crude $97.74
ICE North Sea Brent crude $112.82
Spread (ICE- NYMEX) = $15.08 (last report, $14.16)

Here are the August contracts* with a narrower spread:

NYMEX light sweet crude $98.43
ICE North Sea Brent crude $112.11
Spread (ICE- NYMEX) = $13.68 (last report, $12.41)

* NYMEX futures contracts have rolled forward, we now show June and August.

NYMEX WTI 1-month CRS© is 1.82% (bullish stability level); CRS© divergence (Oil bearish overall)

Prices remain high for 2012 but have pulled back dramatically, we have $110+ Brent and $95+ NYMEX in August still favoring high oil prices this summer. A front-month spread between Brent and WTI >$20/bbl is a trouble sign.

Daily Debt Crisis Watch

July 26th we introduced the Debt Crisis Index (DCI). The DCI is computed in the mornings and at the market close Friday in much the same way we do the EMI and GVI indices. Today, the DCI is 79.1 up from last report's 77.9. A level above 200 is time for serious concern - we are now well below that level. The highest level recorded since inception was 271.0 Aug. 9, 2011; the lowest level is 65.1 on Mar. 13, 2012

Global sovereign debt issues have been an overhang on markets for many, many months starting with the Dubai crisis in late November, 2009 and spreading to the euro-zone in 2010-2011 and continuing into 2012.

Stock Market Morning Update

The DOW is down 31.22 points to 13,007.05; the S&P 500 is down 0.61 points at 1,368.49

The Eureka Miner's Grubstake Portfolio is down 0.86% at $1,290,165.86 (what's this?).

Cheers,

Colonel Possum

Headline photograph by Mariana Titus

Write Colonel Possum at colonelpossum@gmail.com for answers to your questions or to request e-mail updates on the market

Friday, May 4, 2012

The Colonel's Friday Thoughts on Gold, Silver & Copper; Lousy Jobs Report

La Loquita

Latest Nevada Gas Prices (click this link)

NEW FORMAT for 2012

Morning Commentary
Daily Market Roundup
- Gold & Silver Report
- Copper & Molybdenum Report
- Oil Watch
- Debt Crisis Watch
- Stock Market Morning Update
- Eureka Miner's Million Dollar Grubstake Portfolio


My latest Kitco commentary: 2012 Copper and Gold - Is a Red Metal Crash Next? (4/16/2012)

My Latest International Business Times commentary: Silver & Gold, “Situation Normal…” (03/26/2012)

This morning's...
COMEX Gold price = $1,637.9/oz (June contract most active)
Eureka Miner’s Gold Value Index© (GVI) = 90.89 (gold value moving sideways)
Value Adjusted Gold Price© (VAGP) = $1,505.8/oz
COMEX - VAGP = $132.1/oz; gold is trading at a premium to key commodities; the gold-to-copper ratio remains below its 3-month average (Cu weakly bullish)


Morning Miners!

It is 6:01 AM. Today finds us somewhere between Old Miner's Cold Reality coffee and Ruby T's Blue Sky java. Let me pour you a delicious cup of old reliable Raine's Red Label. Have a great weekend.

The Colonel's Friday Thoughts on Gold, Silver & Copper; Lousy Jobs Report

Nuts. Today's monthly Labor Department report showed the U.S. economy added fewer jobs than expected last month. Nonfarm payrolls grew by 115,000 in April, versus an anticipated an increase of 168,000 jobs. Although the unemployment rate dropped a tenth of percentage point to 8.1% some of the decline was due to people leaving the work force.

Gold, silver and copper reacted to the report in much the same way initially bouncing higher, then a move down and then a move back up a bit. The bounce was most likely traders betting that disappointing employment numbers may improve the chance for further quantitative easing (e.g. QE3) which typically boosts US dollar-denominated commodity prices.

COMEX gold went from $1,633.2 per ounce at 8:25 AM EDT to $1,642.1 then $1,634.8 by 8:40 AM EDT. Presently COMEX gold is trading at $1,637.9 per ounce. COMEX silver flirted with $29 per ounce before the report and is presently at $30.165 per ounce. COMEX copper is up a tenth of a penny from yesterday's close at $3.7370 per pound after briefly touching $3.7525.

Friday's jobs report is the second weaker-than-expected reading in a row and pushes the Eureka Miner's Index© (EMI) below the key 100-level at 97.10 (see Mining Report below). Seventeen of nineteen global markets are in the red. Nuts.

Here is my input to the Weekly Kitco Gold Survey:

Q. Where do you see gold’s price headed next week, up, down or unchanged?

A. Down, $1,615 per ounce target.

Q. Why?

A> It is likely that COMEX gold will test its April intraday low ($1,613.0/oz) on worsening news from Europe. Without a new catalyst, gold will probably continue to trade near this low and the April high at $1,685.4/oz for the near-term. My target next week is therefore biased to the lower end of the trading range (note 1).

Precious and base metal prices continue to be range-bound and relatively stable from early April into May as central banks attempt to manage a global slowdown and Europe shows signs of deepening financial crisis. Accommodative monetary is generally bullish for gold but the European debt crisis dampens price increases. Given lower demand expectations, base metals like copper are supported by growing supply tightness.

Lacking any major geopolitical shocks, price crashes in either precious or base metals are unlikely. For example, 3-month copper price volatility remains less than (0.93X) gold and gold ratios are still very stable (e.g., gold-to-copper & gold-to-silver). However, there has been bearish expansion of the gold-to-silver ratio since April 23.


For $1,615 per ounce gold we can expect to see silver in a range of $29.5-$31.5 per ounce; and copper, $3.58-$3.91 per pound.

Background Notes:

1. With expectations for further bad headlines in Europe, my target is biased below the geometric mean ($1,648.8 per ounce) of the April low and high.
2. Given the target gold price, the copper and silver price ranges are derived from the 1-month gold ratio mean (GCR & GSR) and respective ratio stability (CRS©)
3. My Gold Value Index© (GVI) equals 90.89 this morning down 17.3% from the Oct. 4 high of 109.97. The GVI is presently moving sideways.
4. The gold-to-copper ratio today is 438.29 pounds per ounce and below its 3-month moving average of 443.45 pounds per ounce. Remaining below this average and trending away from the 400 pounds per ounce level is bullish for copper but the recent de-correlation with gold on a 1-month basis is potentially bearish (1-month rolling correlation is +0.02; 3-month is +0.50). 3-month relative volatility is 0.93X gold and price sensitivity (beta) is +0.46.
5. The gold-to-silver ratio is trending above its historical norm at 54.298 (bearish); 3-month rolling correlation is +0.89, relative volatility is 1.71X gold and price sensitivity (beta) is 1.52
6. The SPDR Gold Trust (GLD) is bouncing off its 300-day average and the PowerShares DB US Dollar Index Bullish Fund (UUP) is just above its 200-day average.

Daily Market Roundup


Mining Report

This morning's mining stocks...

Barrick (ABX) $38.24 up 0.68%
Newmont (NEM) $46.49 up 1.97%
McEwen Mining (MUX) 3.36 down 0.30% (formerly US Gold, UXG)
General Moly (Eureka Moly, LLC) (GMO) $2.89 down 2.69%
Thompson Creek (TC) $5.53 down 2.12%
Freeport-McMoRan (FCX) $36.18 down 1.87% (a bellwether mining stock spanning copper, gold & molybdenum)
Timberline Resources (TLR) $0.40 down 2.44%

The Steels  (a "tell" for General Moly & Thompson Creek):

ArcelorMittal (MT) $16.09 down 2.78% - global steel producer
POSCO (PKX) $81.35 down 1.14% - South Korean integrated steel producer

The Eureka Miner's Index© (EMI) was re-calibrated 2/8 to reflect current 200-day moving averages for benchmark miners.

The EMI is below-par at 97.10, down from last report's 114.67 and below the 1-month moving average of 122.78. The 1-month average is falling but still above the key 100-level.

The EMI gives us the market temperature for the factors that have the greatest impact on mining in Eureka County. The record 2010-2012 high for the EMI is 816.78 set 01/04/2011; the low was set 10/4/2011 at 22.88. An EMI of 100 is the boundary between hot and cold markets for the metals & miners.

Gold & Silver Report

This morning's...

COMEX gold is up $3.1/oz at $1,637.9/oz (June contract, most active)

COMEX silver is up $0.155/oz at $30.165/oz (July contract, most active)

The gold-to-silver ratio (Au:Ag) is 54.298 oz/oz

Silver 1-month CRS© is 1.65% (bullish stability level); very stable ratio; 1-month & 3-month < 3% but divergent trend forming (Ag overall indicators bearish)

The Eureka Miner’s Gold Value Index© (GVI) is below-par at 90.89, up from last report's 89.17 and below its 1-month average of 89.88. Gold value is oscillating about its average and moving sideways. The record high for 2010-2012 is 109.97 set on Oct. 4, 2011.

The Value Adjusted Gold Price© (VAGP) is $1,505.8/oz which is $132.1/oz below the current COMEX gold price.

The GVI gauges the value of gold in relation to oil, copper and silver independent of currency. These three commodities were chosen for relative value comparison because 1) oil derivatives are a common cost element for all miners, 2) copper has proven to be a reliable proxy for global growth and 3) silver is a precious and industrial metal that now competes with gold for investment and as a hedge against fiat currencies.

The Value Adjusted Gold Price (VAGP) is a level that supports current oil, copper & oil prices based on historical commodity norms. If the daily COMEX price is less than the VAGP, then gold is undervalued; if above, overvalued.

Copper & Molybdenum Report

This morning's...

COMEX copper is down $0.0010/lb at $3.7370/lb (July contract, most active)

The gold-to-copper ratio is 438.29 lb/oz; ratios in excess of 400 lb/oz are indicative of a bearish price domian; the ratio is below its 3-month moving average of 443.45 (Cu bullish trend in a bearishPrice Domain B)

Copper 1-month CRS© is 2.17% (bullish stability level); very stable ratio; 1-month & 3-month < 3% (overall indicators weakly bullish)

The latest molybdenum oxide spot and futures prices (courtesy of Thompson Creek Metals):

Metals Week Average:
US$14.15
As of May 7, 2012
(updated weekly)

Ryan's Notes Average:
US$14.20
As of May 1, 2012
(updated twice weekly)

European Molybdenum Oxide (Bloomberg average price, updated Wednesday & Friday):
US$14.15/lb

London metal Exchange (LME) molybdenum 3-month seller's contract:

US$14.29/lb (US$31,500/metric ton)

Daily Oil Watch

Latest Nevada Gas Prices (click this link)

Understanding the Price of Oil (click this link for a quick overview on crude oil prices)

On February 1st, 2011, we identified North Sea Brent crude oil as a good barometer for the crises in the Middle East and North Africa (MENA). The next conflict could be in the Persian Gulf. Brent remains above $110/bbl maintaining a spread above the North American benchmark, Western Texas Intermediate or "Texas light sweet crude", traded on the NYMEX.

Here are the key front-month contracts this morning:

NYMEX light sweet crude $100.09
ICE North Sea Brent crude $114.25
Spread (ICE- NYMEX) = $14.16 (last report, $13.33)

Here are the August contracts* with a narrower spread:

NYMEX light sweet crude $100.83
ICE North Sea Brent crude $113.74
Spread (ICE- NYMEX) = $12.41 (last report, $12.08)

* NYMEX futures contracts have rolled forward, we now show June and August.

NYMEX WTI 1-month CRS© is 1.65% (bullish stability level); CRS© convergence (Oil neutral)

Prices remain high for 2012, we have $110+ Brent and $100+ NYMEX in August favoring high oil prices this summer. A front-month spread between Brent and WTI >$20/bbl is a trouble sign.

Daily Debt Crisis Watch

July 26th we introduced the Debt Crisis Index (DCI). The DCI is computed in the mornings and at the market close Friday in much the same way we do the EMI and GVI indices. Today, the DCI is 77.0 down from last report's 70.9. A level above 200 is time for serious concern - we are now well below that level. The highest level recorded since inception was 271.0 Aug. 9, 2011; the lowest level is 65.1 on Mar. 13, 2012

Global sovereign debt issues have been an overhang on markets for many, many months starting with the Dubai crisis in late November, 2009 and spreading to the euro-zone in 2010-2011 and continuing into 2012.

Stock Market Morning Update

The DOW is down 120.41 points to 13,086.18; the S&P 500 is down 15.52 points at 1,376.05

The Eureka Miner's Grubstake Portfolio is down 0.67% at $1,301,613.26 (what's this?).

Cheers,

Colonel Possum

Headline photograph by Mariana Titus

Write Colonel Possum at colonelpossum@gmail.com for answers to your questions or to request e-mail updates on the market

Thursday, May 3, 2012

The General Brings Eric Dodge to Eureka

Red Metal Morning Art by Mariana Titus

Latest Nevada Gas Prices (click this link)

NEW FORMAT for 2012

Morning Commentary
Daily Market Roundup
- Gold & Silver Report
- Copper & Molybdenum Report
- Oil Watch
- Debt Crisis Watch
- Stock Market Morning Update
- Eureka Miner's Million Dollar Grubstake Portfolio


My latest Kitco commentary: 2012 Copper and Gold - Is a Red Metal Crash Next? (4/16/2012)

My Latest International Business Times commentary: Silver & Gold, “Situation Normal…” (03/26/2012)

This morning's...
COMEX Gold price = $1,639.6/oz (June contract most active)
Eureka Miner’s Gold Value Index© (GVI) = 89.17 (gold value moving sideways)
Value Adjusted Gold Price© (VAGP) = $1,536.4/oz
COMEX - VAGP = $103.2/oz; gold is trading at a premium to key commodities; the gold-to-copper ratio remains below its 3-month average (Cu weakly bullish)


Þūnresdæg
Morning Miners!

It is 6:34 AM. Have a steaming cup of Thor's Party Hearty java. Our favorite Norseman has been polishing up his Viking boots for some fun times coming our way in Eureka and Crescent Valley...

The General Brings Eric Dodge to Eureka


General Moly (GMO) will bring the Eric Dodge Band to the Eureka Opera House for a little toe-tappin' and two-steppin'. The event will be from 5:30 p.m. to 8:30 p.m. May 17 featuring food and a great band from St. George, Utah - the ole Colonel and Mariana plan to be there!

Mining Editor Adella Harding did a nice story on this and a second event planned for the community center in Crescent Valley the day before, May 16 from 5:30 p.m. to 8:30 p.m. The Crescent Valley shindig will have a barbecue and live music. Here are the details:

General Moly plans community events (Adella Harding, Elko Daily Free Press, 5/2/2012)

As reported by Adella, "General Moly Inc. plans two events this month to show appreciation to Eureka County communities for their support of the company’s efforts to permit the Mt. Hope molybdenum project. The company also will project updates at the events, Zach Spencer, manager of external communications for General Moly, said Wednesday."

Yee-ha! See you there.

Daily Market Roundup


Mining Report

This morning's mining stocks...

Barrick (ABX) $38.50 down 2.18%
Newmont (NEM) $46.31 down 1.68%
McEwen Mining (MUX) 3.46 down 3.89% (formerly US Gold, UXG)
General Moly (Eureka Moly, LLC) (GMO) $3.02 down 1.31%
Thompson Creek (TC) $5.86 down 1.68%
Freeport-McMoRan (FCX) $37.63 down 1.29% (a bellwether mining stock spanning copper, gold & molybdenum)
Timberline Resources (TLR) $0.43 unchanged

The Steels  (a "tell" for General Moly & Thompson Creek):

ArcelorMittal (MT) $16.88 down 0.59% - global steel producer
POSCO (PKX) $83.21 down 0.17% - South Korean integrated steel producer

The Eureka Miner's Index© (EMI) was re-calibrated 2/8 to reflect current 200-day moving averages for benchmark miners.

The EMI is below-par at 114.67, down from last report's 116.21 and below the 1-month moving average of 126.80. The 1-month average is falling but still above the key 100-level.

The EMI gives us the market temperature for the factors that have the greatest impact on mining in Eureka County. The record 2010-2012 high for the EMI is 816.78 set 01/04/2011; the low was set 10/4/2011 at 22.88. An EMI of 100 is the boundary between hot and cold markets for the metals & miners.

Gold & Silver Report

This morning's...

COMEX gold is down $14.4/oz at $1,639.6/oz (June contract, most active)

COMEX silver is down $0.240/oz at $30.450/oz (July contract, most active)

The gold-to-silver ratio (Au:Ag) is 53.865 oz/oz

Silver 1-month CRS© is 1.66% (bullish stability level); very stable ratio; 1-month & 3-month < 3% but divergent trend forming (Ag overall indicators bearish)

The Eureka Miner’s Gold Value Index© (GVI) is below-par at 89.17, down from last report's 89.42 and below its 1-month average of 89.75. Gold value is oscillating about its average and moving sideways. The record high for 2010-2012 is 109.97 set on Oct. 4, 2011.

The Value Adjusted Gold Price© (VAGP) is $1,536.4/oz which is $103.2/oz below the current COMEX gold price.

The GVI gauges the value of gold in relation to oil, copper and silver independent of currency. These three commodities were chosen for relative value comparison because 1) oil derivatives are a common cost element for all miners, 2) copper has proven to be a reliable proxy for global growth and 3) silver is a precious and industrial metal that now competes with gold for investment and as a hedge against fiat currencies.

The Value Adjusted Gold Price (VAGP) is a level that supports current oil, copper & oil prices based on historical commodity norms. If the daily COMEX price is less than the VAGP, then gold is undervalued; if above, overvalued.

Copper & Molybdenum Report

This morning's...

COMEX copper is down $0.0200/lb at $3.7670/lb (July contract, most active)

The gold-to-copper ratio is 435.25 lb/oz; ratios in excess of 400 lb/oz are indicative of a bearish price domian; the ratio is below its 3-month moving average of 443.59 (Cu bullish trend in a bearishPrice Domain B)

Copper 1-month CRS© is 2.30% (bullish stability level); very stable ratio; 1-month & 3-month < 3% (overall indicators weakly bullish)

The latest molybdenum oxide spot and futures prices (courtesy of Thompson Creek Metals):

Metals Week Average:
US$14.175
As of April 30, 2012
(updated weekly)

Ryan's Notes Average:
US$14.20
As of May 1, 2012
(updated twice weekly)

European Molybdenum Oxide (Bloomberg average price, updated Wednesday & Friday):
US$14.15/lb

London metal Exchange (LME) molybdenum 3-month seller's contract:

US$14.29/lb (US$31,500/metric ton)

Daily Oil Watch

Latest Nevada Gas Prices (click this link)

Understanding the Price of Oil (click this link for a quick overview on crude oil prices)

On February 1st, 2011, we identified North Sea Brent crude oil as a good barometer for the crises in the Middle East and North Africa (MENA). The next conflict could be in the Persian Gulf. Brent remains above $115/bbl maintaining a spread above the North American benchmark, Western Texas Intermediate or "Texas light sweet crude", traded on the NYMEX.

Here are the key front-month contracts this morning:

NYMEX light sweet crude $104.31
ICE North Sea Brent crude $117.64
Spread (ICE- NYMEX) = $13.33 (last report, $13.36)

Here are the August contracts* with a narrower spread:

NYMEX light sweet crude $104.95
ICE North Sea Brent crude $117.03
Spread (ICE- NYMEX) = $12.08 (last report, $12.10)

* NYMEX futures contracts have rolled forward, we now show June and August.

NYMEX WTI 1-month CRS© is 1.12% (bullish stability level); CRS© convergence (Oil neutral)

Prices remain high for 2012, we have $115+ Brent and $100+ NYMEX in August favoring high oil prices this summer. A front-month spread between Brent and WTI >$20/bbl is a trouble sign.

Daily Debt Crisis Watch

July 26th we introduced the Debt Crisis Index (DCI). The DCI is computed in the mornings and at the market close Friday in much the same way we do the EMI and GVI indices. Today, the DCI is 70.9 down from last report's 71.9. A level above 200 is time for serious concern - we are now well below that level. The highest level recorded since inception was 271.0 Aug. 9, 2011; the lowest level is 65.1 on Mar. 13, 2012

Global sovereign debt issues have been an overhang on markets for many, many months starting with the Dubai crisis in late November, 2009 and spreading to the euro-zone in 2010-2011 and continuing into 2012.

Stock Market Morning Update

The DOW is down 20.66 points to 13,247.91; the S&P 500 is down 3.21 points at 1,399.10

The Eureka Miner's Grubstake Portfolio is down 1.21% at $1,328,144.40 (what's this?).

Cheers,

Colonel Possum

Headline photograph by Mariana Titus

Write Colonel Possum at colonelpossum@gmail.com for answers to your questions or to request e-mail updates on the market

Wednesday, May 2, 2012

General Moly Announces 1Q 2012; Water Rights & Permitting Update

Lichenometry tells you how long this rock has been exposed

Latest Nevada Gas Prices (click this link)

NEW FORMAT for 2012

Morning Commentary
Daily Market Roundup
- Gold & Silver Report
- Copper & Molybdenum Report
- Oil Watch
- Debt Crisis Watch
- Stock Market Morning Update
- Eureka Miner's Million Dollar Grubstake Portfolio


My latest Kitco commentary: 2012 Copper and Gold - Is a Red Metal Crash Next? (4/16/2012)

My Latest International Business Times commentary: Silver & Gold, “Situation Normal…” (03/26/2012)

This morning's...
COMEX Gold price = $1,655.5/oz (June contract most active)
Eureka Miner’s Gold Value Index© (GVI) = 89.42 (gold value moving sideways)
Value Adjusted Gold Price© (VAGP) = $1,546.9/oz
COMEX - VAGP = $108.6/oz; gold is trading at a premium to key commodities; the gold-to-copper ratio remains below its 3-month average (Cu bullish)


Wōdnesdæg
Morning Miners!

It is 5:56 AM. Have a cold cup of Old Miner Woden's lousy I-Told-You-So coffee...or some delicious hot Red Label in the hi-bay. Our mining curmudgeon couldn't wait to tell me it would be a bad market today after the Dow rose closed Tuesday at its highest level since Dec. 28, 2007.

"Yee-ha!", he exclaimed, "The ADP report is worse than anyone expected. The propeller heads thought we'd add 175,000 new private sector jobs in April and it's only 119,000. We got a bunch of low-grade Euro-data this morning too - I told you everything was going to hell in an ore cart!"

I couldn't wait to tell Woden that his cherished gold was down 6 bucks at $1,655.5 per ounce on the COMEX, my prediction last Friday was $1,650 for the week.

"Phooey, gold will be over $2,000 when the world ends in December!"

"What good will gold do you if we're sucked into a black hole before Christmas?"

"I'll be fine in my cave...got food, water, ammo and I'm high enough up to miss the 5,000 foot tidal wave!"

No use arguing with Old Miner Woden, let's see how General Moly is doing...

General Moly Announces 1Q 2012; Water Rights & Permitting Update

General Moly released their latest quarterly report at 5:44 AM PDT:

General Moly Announces First Quarter 2012 Results (Press Release, 5/2/2012)

Not too much new here, additional financing and mine construction later this year all depend on a successful outcome on the water rights issue and obtaining all the remaining Mt. Hope permits. Here are their thoughts on these key topics:

MT. HOPE PROJECT WATER RIGHTS UPDATE

On July 15, 2011, the Nevada State Engineer issued a second Ruling granting the Company's water right applications for the Mt. Hope Project's mining operations. Permits subject to the State Engineer's Ruling were issued in December 2011 and January 2012. Pending a successful outcome of an appeal of the Ruling discussed below, the water will become available for consumptive use following the State Engineer's approval of a Monitoring, Management and Mitigation Plan ("3M Plan"). The Company is finalizing its proposed 3M Plan, developed with input from Eureka County, and we anticipate the State Engineer to approve the 3M Plan prior to the receipt of Federal permits in the second half of this year.
In August 2011, Eureka County and two other parties comprised of three individual water rights holders in Diamond Valley and one in Kobeh Valley, filed Petitions with the Nevada State District Court appealing the Ruling of the State Engineer. An appeal hearing took place on April 3, 2012 before the Nevada District Court. A decision by the District Court is expected by mid-2012, although the District Court is not required to act under any specified timeline. We continue to anticipate a favorable District Court decision, upholding the State Engineer's Ruling. Pending a successful outcome of the appeal hearing, and approval of the 3M Plan, the Company will have the right to use the water for construction and operations at the Mt. Hope Project.


MT. HOPE PROJECT PERMITTING UPDATE

The Bureau of Land Management ("BLM") published the Mt. Hope Draft Environmental Impact Statement ("EIS") for public comment on December 2, 2011. The public comment period concluded on March 1, 2012. The BLM is now in the process of considering comments received in the development of a Final EIS. Once the Final EIS is completed, it will be advanced toward publication through the Notice of Availability process within the U.S. Department of the Interior and thereafter published in the Federal Register for a 30-day period. Following the close of this period, we anticipate the BLM to issue a Record of Decision ("ROD") allowing the Company to initiate construction activities. Based on a larger number of comments than expected during the public comment period, the Company now anticipates the ROD to be issued in the second half of this year, although circumstances beyond our control, including agency delays or requests for additional information or studies, could cause the ROD to be delayed.
In addition to the ROD, three Nevada state-issued permits are viewed as major environmental permits. These are the Water Pollution Control Permit, the Air Quality Permit and the Reclamation Permit. The Company continues to develop the applications and supporting information for these permits. These three permits are anticipated to be received before the issuance of ROD.


Separate from the report, a faithful follower of the Eureka Miner just reminded the ole Colonel that General Moly has posted these Mt. Hope career opportunities:

Mt. Hope Career Opportunities


I don't know the status of filling these jobs to date.

Daily Market Roundup


Mining Report

This morning's mining stocks...

Barrick (ABX) $39.50 down 2.32%
Newmont (NEM) $46.89 down 2.41%
McEwen Mining (MUX) 3.70 down 4.15% (formerly US Gold, UXG)
General Moly (Eureka Moly, LLC) (GMO) $3.11 unchanged
Thompson Creek (TC) $5.92 down 1.00%
Freeport-McMoRan (FCX) $38.14 down 0.83% (a bellwether mining stock spanning copper, gold & molybdenum)
Timberline Resources (TLR) $0.44 up 2.33%

The Steels  (a "tell" for General Moly & Thompson Creek):

ArcelorMittal (MT) $17.17 down 1.89% - global steel producer
POSCO (PKX) $83.27 down 0.67% - South Korean integrated steel producer

The Eureka Miner's Index© (EMI) was re-calibrated 2/8 to reflect current 200-day moving averages for benchmark miners.

The EMI is below-par at 116.21, up from last report's 130.53 and below the 1-month moving average of 129.94. The 1-month average is falling but still above the key 100-level.

The EMI gives us the market temperature for the factors that have the greatest impact on mining in Eureka County. The record 2010-2012 high for the EMI is 816.78 set 01/04/2011; the low was set 10/4/2011 at 22.88. An EMI of 100 is the boundary between hot and cold markets for the metals & miners.

Gold & Silver Report

This morning's...

COMEX gold is down $6.9/oz at $1,655.5/oz (June contract, most active)

COMEX silver is down $0.335/oz at $30.575/oz (July contract, most active)

The gold-to-silver ratio (Au:Ag) is 54.146 oz/oz

Silver 1-month CRS© is 1.64% (bullish stability level); very stable ratio; 1-month & 3-month < 3% but divergent trend forming (Ag overall indicators bearish)

The Eureka Miner’s Gold Value Index© (GVI) is below-par at 89.42, down from last report's 89.48 and below its 1-month average of 89.75. Gold value is oscillating about its average and moving sideways. The record high for 2010-2012 is 109.97 set on Oct. 4, 2011.

The Value Adjusted Gold Price© (VAGP) is $1,546.9/oz which is $108.6/oz below the current COMEX gold price.

The GVI gauges the value of gold in relation to oil, copper and silver independent of currency. These three commodities were chosen for relative value comparison because 1) oil derivatives are a common cost element for all miners, 2) copper has proven to be a reliable proxy for global growth and 3) silver is a precious and industrial metal that now competes with gold for investment and as a hedge against fiat currencies.

The Value Adjusted Gold Price (VAGP) is a level that supports current oil, copper & oil prices based on historical commodity norms. If the daily COMEX price is less than the VAGP, then gold is undervalued; if above, overvalued.

Copper & Molybdenum Report

This morning's...

COMEX copper is down $0.0655/lb at $3.7780/lb (July contract, most active)

The gold-to-copper ratio is 438.19 lb/oz; ratios in excess of 400 lb/oz are indicative of a bearish price domian; the ratio is below its 3-month moving average of 443.76 (Cu bullish trend in a bearishPrice Domain B)

Copper 1-month CRS© is 2.32% (bullish stability level); very stable ratio; 1-month & 3-month < 3% (overall indicators mildly bullish)

The latest molybdenum oxide spot and futures prices (courtesy of Thompson Creek Metals):

Metals Week Average:
US$14.175
As of April 30, 2012
(updated weekly)

Ryan's Notes Average:
US$14.20
As of May 1, 2012
(updated twice weekly)

European Molybdenum Oxide (Bloomberg average price, updated Wednesday & Friday):
US$14.15/lb

London metal Exchange (LME) molybdenum 3-month seller's contract:

US$14.29/lb (US$31,500/metric ton)

Daily Oil Watch

Latest Nevada Gas Prices (click this link)

Understanding the Price of Oil (click this link for a quick overview on crude oil prices)

On February 1st, 2011, we identified North Sea Brent crude oil as a good barometer for the crises in the Middle East and North Africa (MENA). The next conflict could be in the Persian Gulf. Brent remains above $115/bbl maintaining a spread above the North American benchmark, Western Texas Intermediate or "Texas light sweet crude", traded on the NYMEX.

Here are the key front-month contracts this morning:

NYMEX light sweet crude $105.73
ICE North Sea Brent crude $119.09
Spread (ICE- NYMEX) = $13.36 (last report, $14.24)

Here are the August contracts* with a narrower spread:

NYMEX light sweet crude $106.29
ICE North Sea Brent crude $118.39
Spread (ICE- NYMEX) = $12.10 (last report, $12.85)

* NYMEX futures contracts have rolled forward, we now show June and August.

NYMEX WTI 1-month CRS© is 1.19% (bullish stability level); CRS© weak convergence (Oil neutral)

Prices remain high for 2012, we have $115+ Brent and $105+ NYMEX in August favoring high oil prices this summer. A front-month spread between Brent and WTI >$20/bbl is a trouble sign.

Daily Debt Crisis Watch

July 26th we introduced the Debt Crisis Index (DCI). The DCI is computed in the mornings and at the market close Friday in much the same way we do the EMI and GVI indices. Today, the DCI is 71.9 up from last report's 68.3. A level above 200 is time for serious concern - we are now well below that level. The highest level recorded since inception was 271.0 Aug. 9, 2011; the lowest level is 65.1 on Mar. 13, 2012

Global sovereign debt issues have been an overhang on markets for many, many months starting with the Dubai crisis in late November, 2009 and spreading to the euro-zone in 2010-2011 and continuing into 2012.

Stock Market Morning Update

The DOW is down 71.37 points to 13,207.95; the S&P 500 is down 9.791 points at 1,396.03

The Eureka Miner's Grubstake Portfolio is down 1.24% at $1,349,155.35 (what's this?).

Cheers,

Colonel Possum

Headline photograph by Mariana Titus

Write Colonel Possum at colonelpossum@gmail.com for answers to your questions or to request e-mail updates on the market

Tuesday, May 1, 2012

One Less Secret in Secret Canyon - "Patience is a Virtue?"

Secret Building? Secret Canyon, Eureka County, Nevada

Latest Nevada Gas Prices (click this link)

NEW FORMAT for 2012

Morning Commentary
Daily Market Roundup
- Gold & Silver Report
- Copper & Molybdenum Report
- Oil Watch
- Debt Crisis Watch
- Stock Market Morning Update
- Eureka Miner's Million Dollar Grubstake Portfolio


My latest Kitco commentary: 2012 Copper and Gold - Is a Red Metal Crash Next? (4/16/2012)

My Latest International Business Times commentary: Silver & Gold, “Situation Normal…” (03/26/2012)

This morning's...
COMEX Gold price = $1,669.2/oz (June contract most active)
Eureka Miner’s Gold Value Index© (GVI) = 89.48 (gold value moving sideways)
Value Adjusted Gold Price© (VAGP) = $1,558.6/oz
COMEX - VAGP = $110.6/oz; gold is trading at a premium to key commodities; the gold-to-copper ratio remains below its 3-month average (Cu bullish)


Morning Miners!

It is 5:58 AM. Have a cup of Ruby T's ever optimistic Blue Skies java. Our market bull is in a fine mood even though the red metal is only up a tenth of a penny - at least it's up, COMEX copper trades at $3.8305 per pound this morning. Old Miner Woden would be happy too. Our market curmudgeon at least treasures gold and its up $5.0 at $1,669.2 per pound. With everyone happy let's hop in Ruby's F-250 on May Day and take a little break from the markets. Where are we going? Why that's a secret!

One Less Secret in Secret Canyon - "Patience is a Virtue?"

In the 1980s my neighbor Eric Pastorino took Mariana and the Colonel on a tour of Eureka's back country. We weren't neighbors then, just friends - Mariana and I wouldn't buy the old Kitchen house up from his place until 2002. With some irony there is a photo of us after this outing with the Kitchen house in the background. Isabel Kitchen was still alive then; her husband Joe and his brother Hiram ran the Kitchen Market downtown before it became Raine's Market.

Eric took us south of town and we turned onto Windfall Canyon Road to visit the old Windfall Mine and then on to Ratto Canyon and Secret Canyon. There is a lot of mining history in this area which will be the subject of future stories of this report: south and a bit east of Eureka there was the town of Vanderbilt, a settlement called Prospect and a milling camp named Pinto. All three served the mining interests in the Secret Canyon District and the nearby Silverado (Pinto) District in White Pine County. All three are ghost ruins these days - great exploring, pardner.

The subject of this tale is a large abandoned building in Secret Canyon. It is not a ghost of the late-1800s mining boom but supported renewed 1970s mining interests in the same area that drew miners to the canyons during the Vanderbilt days. Some enterprising Eureka locals used this structure as a test plant for a heap leach pilot operation. They leached the old timer tunnel dumps in Secret Canyon and also processed some preliminary exploration drill samples as well as dump samples. What they found was apparently more lead and silver than gold (a more detailed history of this operation is in the works).


Eric has had his eye on this building for a long time, "It has been there almost 40 years...hard to believe no one shot holes in it!" In 2005 he had a preliminary agreement with the BLM to take possession of the building but "the deal went south." More recently, new management in the BLM office and the state office in Reno found Superfund money to cleanup low levels of lead inside the Secret Canyon building and around the test plant site.


The BLM hired Cross Environmental, an environmental contractor from Florida, to handle the cleanup. They were supported by Eric Pastorino and his crew whose job was to dismantle the building and haul refuse to the the landfill in Beatty. Jim Brietrick and Steve Jackson were on Eric's crew and Tom Damele assisted him "by providing me with a truck tire when I blew one near his ranch on the way to Beatty." A real team effort out here in the back country!

Eric says he "obtained the building as a reward for my services" and hopes "to put it up at Phil Wilson's location out by Third St in Diamond Valley...I waited 7 years for this deal with the BLM - patience is a virtue?"

Here is the impressive timeline of the 5-day tear-down and cleanup:

Tuesday - Crew of five from Florida arrived at the site, along with Eric's crew, a BLM representative and an inspector/consultant for the Cross Environmental

Wednesday - The samples inside of the building were cleaned out

Thursday - The sheet metal came down, low level lead samples from the building were hauled to the Beatty non-hazardous section landfill

Friday - The iron structure came down

Saturday - The concrete came out, job completed


Eric thanks his crew, the BLM and Cross Environmental for a job well done.

Daily Market Roundup


Mining Report

This morning's mining stocks...

Barrick (ABX) $40.33 down 0.25%
Newmont (NEM) $47.94 up 0.61%
McEwen Mining (MUX) 3.91 up 3.17% (formerly US Gold, UXG)
General Moly (Eureka Moly, LLC) (GMO) $3.27 up 0.93%
Thompson Creek (TC) $5.99 up 1.01%
Freeport-McMoRan (FCX) $38.46 up 0.42% (a bellwether mining stock spanning copper, gold & molybdenum)
Timberline Resources (TLR) $0.44 up 2.33%

The Steels  (a "tell" for General Moly & Thompson Creek):

ArcelorMittal (MT) $17.33 unchanged - global steel producer
POSCO (PKX) $83.28 up 0.04% - South Korean integrated steel producer

The Eureka Miner's Index© (EMI) was re-calibrated 2/8 to reflect current 200-day moving averages for benchmark miners.

The EMI is below-par at 130.53, up from last report's 124.10 and below the 1-month moving average of 132.77. The 1-month average is falling but still above the key 100-level.

The EMI gives us the market temperature for the factors that have the greatest impact on mining in Eureka County. The record 2010-2012 high for the EMI is 816.78 set 01/04/2011; the low was set 10/4/2011 at 22.88. An EMI of 100 is the boundary between hot and cold markets for the metals & miners.

Gold & Silver Report

This morning's...

COMEX gold is up $5.0/oz at $1,669.2/oz (June contract, most active)

COMEX silver is up $0.224/oz at $31.240/oz (July contract, most active)

The gold-to-silver ratio (Au:Ag) is 53.431 oz/oz

Silver 1-month CRS© is 1.53% (bullish stability level); very stable ratio; 1-month & 3-month < 3% (Ag bullish mid-term stability, overall indicators bearish)

The Eureka Miner’s Gold Value Index© (GVI) is below-par at 89.48, up from last report's 89.23 and below its 1-month average of 89.74. Gold value is oscillating about its average and moving sideways. The record high for 2010-2012 is 109.97 set on Oct. 4, 2011.

The Value Adjusted Gold Price© (VAGP) is $1,558.6/oz which is $110.6/oz below the current COMEX gold price.

The GVI gauges the value of gold in relation to oil, copper and silver independent of currency. These three commodities were chosen for relative value comparison because 1) oil derivatives are a common cost element for all miners, 2) copper has proven to be a reliable proxy for global growth and 3) silver is a precious and industrial metal that now competes with gold for investment and as a hedge against fiat currencies.

The Value Adjusted Gold Price (VAGP) is a level that supports current oil, copper & oil prices based on historical commodity norms. If the daily COMEX price is less than the VAGP, then gold is undervalued; if above, overvalued.

Copper & Molybdenum Report

This morning's...

COMEX copper is up $0.0010/lb at $3.8350/lb (July contract, most active)

The gold-to-copper ratio is 435.77 lb/oz; ratios in excess of 400 lb/oz are indicative of a bearish price domian; the ratio is below its 3-month moving average of 444.49 (Cu bullish trend in a bearishPrice Domain B)

Copper 1-month CRS© is 2.32% (bullish stability level); very stable ratio; 1-month & 3-month < 3% (overall indicators mildly bullish)

The latest molybdenum oxide spot and futures prices (courtesy of Thompson Creek Metals):

Metals Week Average:
US$14.175
As of April 30, 2012
(updated weekly)

Ryan's Notes Average:
US$14.20
As of April 24, 2012
(updated twice weekly)

European Molybdenum Oxide (Bloomberg average price, updated Wednesday & Friday):
US$14.23/lb

London metal Exchange (LME) molybdenum 3-month seller's contract:

US$14.29/lb (US$31,500/metric ton)

Daily Oil Watch

Latest Nevada Gas Prices (click this link)

Understanding the Price of Oil (click this link for a quick overview on crude oil prices)

On February 1st, 2011, we identified North Sea Brent crude oil as a good barometer for the crises in the Middle East and North Africa (MENA). The next conflict could be in the Persian Gulf. Brent remains above $115/bbl maintaining a spread above the North American benchmark, Western Texas Intermediate or "Texas light sweet crude", traded on the NYMEX.

Here are the key front-month contracts this morning:

NYMEX light sweet crude $104.67
ICE North Sea Brent crude $118.91
Spread (ICE- NYMEX) = $14.24 (last report, $15.13)

Here are the August contracts* with a narrower spread:

NYMEX light sweet crude $105.34
ICE North Sea Brent crude $118.19
Spread (ICE- NYMEX) = $12.85 (last report, $13.68)

* NYMEX futures contracts have rolled forward, we now show June and August.

NYMEX WTI 1-month CRS© is 1.15% (bullish stability level); CRS© weak convergence (Oil neutral)

Prices remain high for 2012, we have $115+ Brent and $100+ NYMEX in August favoring high oil prices this summer. A front-month spread between Brent and WTI >$20/bbl is a trouble sign.

Daily Debt Crisis Watch

July 26th we introduced the Debt Crisis Index (DCI). The DCI is computed in the mornings and at the market close Friday in much the same way we do the EMI and GVI indices. Today, the DCI is 68.3 down from last report's 71.5. A level above 200 is time for serious concern - we are now well below that level. The highest level recorded since inception was 271.0 Aug. 9, 2011; the lowest level is 65.1 on Mar. 13, 2012

Global sovereign debt issues have been an overhang on markets for many, many months starting with the Dubai crisis in late November, 2009 and spreading to the euro-zone in 2010-2011 and continuing into 2012.

Stock Market Morning Update

The DOW is up 38.18 points to 13,251.81; the S&P 500 is up 6.21 points at 1,404.12

The Eureka Miner's Grubstake Portfolio is up 0.51% at $1,374,328.59 (what's this?).

Cheers,

Colonel Possum

Photographs by Eric Pastorino

Write Colonel Possum at colonelpossum@gmail.com for answers to your questions or to request e-mail updates on the market